Why is a self-hosted LLM slow?
Troubleshoot a slow self-hosted LLM by isolating request length, waiting time, generation, concurrency, and serving configuration in controlled experiments.

Sarath Chandran

A slow self-hosted LLM needs a workload-based diagnosis. Before changing hardware or model settings, determine where users are waiting: before the request reaches inference, in a serving queue, during generation, or elsewhere in the application.
In enterprise IT operations, when an AI-powered conversational assistant or document extraction pipeline suffers from sluggish response times, the default reaction is often requesting more expensive GPU hardware or arbitrarily shrinking prompt sizes. However, generative language model latency is governed by distinct computational phases: compute-bound prompt prefill, memory-bandwidth-bound autoregressive decoding, queue admission latency, and upstream Retrieval-Augmented Generation (RAG) vector searches. Adding more GPUs to a system whose bottleneck is a slow database query or an un-indexed vector store will produce zero speedup while wasting tens of thousands of dollars in hardware capital.
Key Architecture Rule: Never attempt to optimize LLM performance without isolating the compute prefill phase from the memory-bound decode phase. Diagnosing latency requires segmenting the transaction into Time to First Token (TTFT), Inter-Token Latency (ITL), queue wait time, and external application dependencies.
Capture an empirical, reproducible performance symptom
Before altering configuration parameters or updating model serving flags, engineering teams must capture a deterministic, reproducible benchmark trace using synthetic or authorized test workloads.
To build an actionable symptom profile, record:
- Model & Hardware Specifications: Exact model revision (e.g., Llama-3-70B-Instruct), quantization format (FP16, FP8, INT4), GPU model (e.g., NVIDIA H100 80GB PCIe), tensor parallel count, and host driver versions.
- Serving Engine Parameters: Max model context length, allocated GPU memory utilization ratio, maximum batched tokens, and scheduler settings.
- Workload Characteristics: Input prompt token count, expected output completion token count, and concurrent request arrival rate.
- Observable User Symptom: Does the response freeze before generation begins (high TTFT)? Does text stream slowly like an old teletype machine (high ITL)? Does generation abruptly halt mid-sentence? Does latency spike only when five or more users query the system simultaneously?
Collect both successful and failed transactions. Focusing solely on completed requests creates survivorship bias, obscuring client-side timeouts and server-side connection drops.
Decouple the primary latency boundaries across the inference lifecycle
The NVIDIA benchmarking metrics reference formalizes the operational distinction between first-token delay, inter-token latency, end-to-end latency, and throughput.
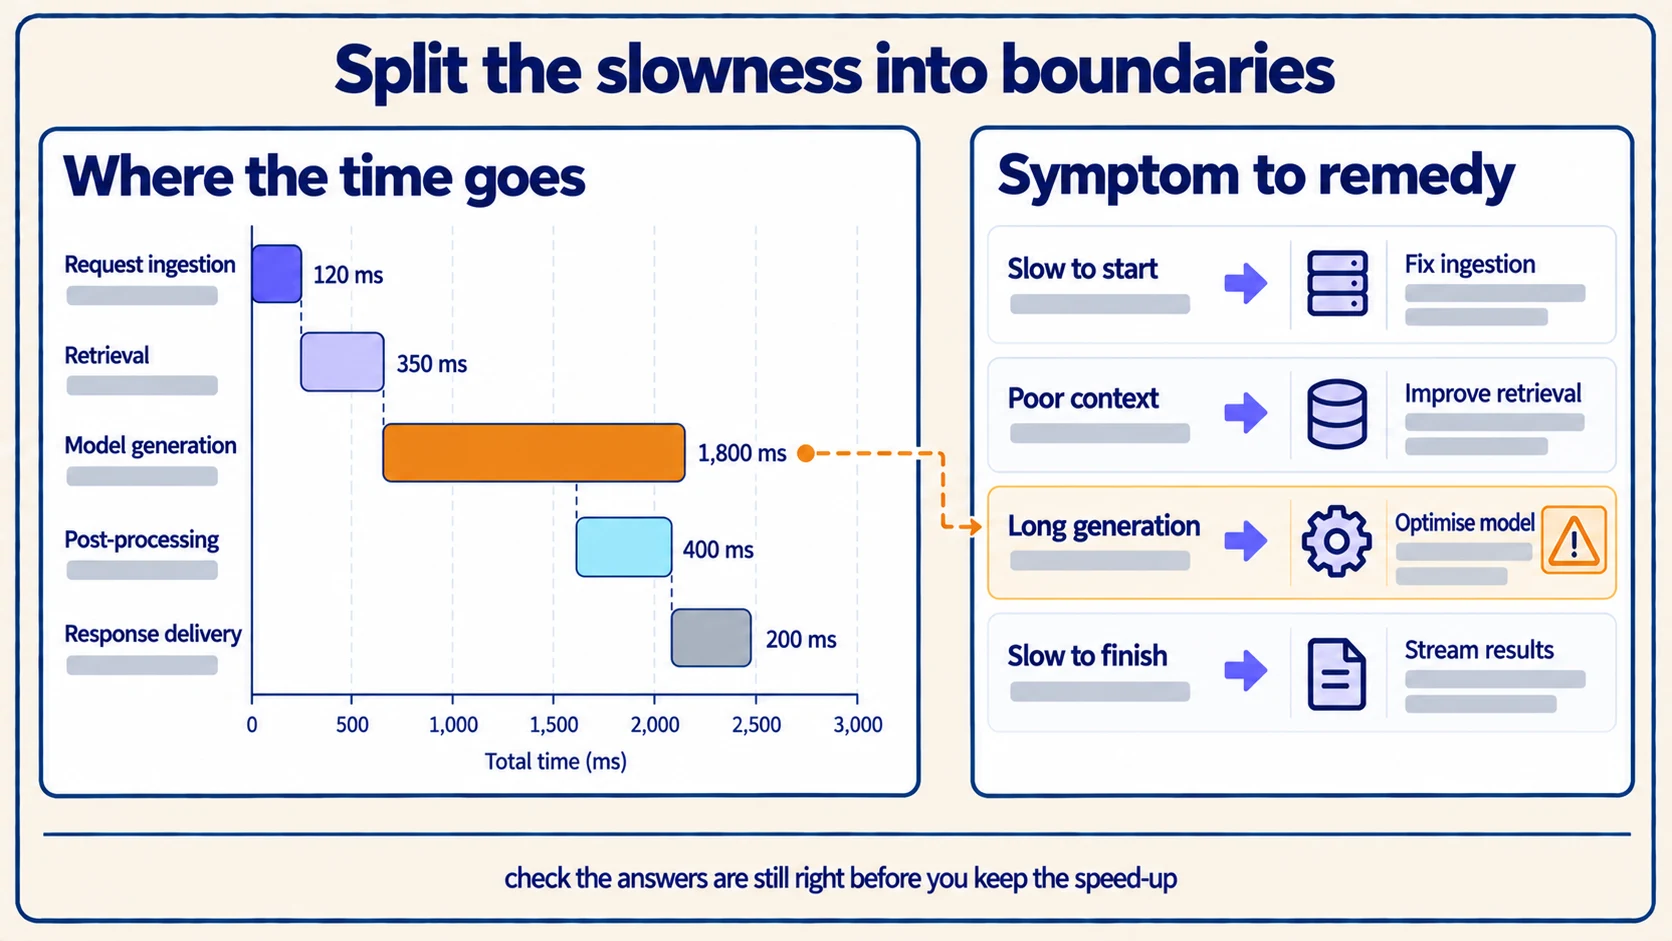
To diagnose performance bottlenecks effectively, decouple the transaction into four distinct stages:
- Stage 1: Pre-Inference Orchestration: Time consumed by the application layer fetching conversation history, querying the vector database for RAG context, and executing authentication checks.
- Stage 2: Queue Admission Wait: Time the prompt sits in the serving engine's FIFO or priority queue waiting for sufficient Key-Value (KV) cache memory to become available on the GPU.
- Stage 3: Prompt Prefill (Compute-Bound): The time required for the GPU tensor cores to process the entire input prompt simultaneously and emit the first token. Prefill scales quadratically with input length.
- Stage 4: Token Decode (Memory-Bandwidth-Bound): The sequential generation of tokens one by one. For every single generated token, the entire model parameter weight matrix must be read from high-bandwidth GPU memory (HBM) into on-chip cache.
Our companion guide on self-hosted AI monitoring provides detailed Prometheus instrumentation strategies to track these timing boundaries in production.
Symptom-to-remedy diagnostic troubleshooting matrix
When diagnosing slow performance, map observable operational symptoms to empirical hypotheses and controlled technical remedies. The table below outlines common enterprise failure modes and proven engineering countermeasures. The examples below are deliberately synthetic and illustrative; they do not represent specific vendor benchmarks or product capabilities.
| Observable operational symptom | Underlying physical or architectural bottleneck | Controlled diagnostic experiment | Targeted technical remedy |
|---|---|---|---|
| High TTFT (> 5s); fast streaming once started. | Long prompt prefill or massive RAG context saturating tensor cores. | Test prompt with 1,000 tokens vs. 16,000 tokens under single-concurrency. | Enable Chunked Prefill; implement prompt prefix caching (vLLM / TensorRT). |
| Normal TTFT; painful inter-token stutter (> 80ms/token). | Memory bandwidth saturation caused by excessive concurrent streams. | Measure ITL at concurrency 1 vs. concurrency 16. | Enable FP8 KV cache quantization; lower max_num_seqs; upgrade to HBM3 GPUs. |
| Latency degrades exponentially under moderate load. | KV cache memory exhaustion forcing requests to queue up outside GPU. | Monitor KV cache block allocation percentage during load test. | Increase gpu_memory_utilization; deploy tensor parallelism across GPUs. |
| First query after reboot takes 3 minutes; subsequent queries take 1s. | Cold model loading from slow network storage (NFS/spinning disk). | Compare cold container start time against warm cached execution. | Pre-warm models on boot; store weights on local high-speed PCIe Gen5 NVMe. |
| Inference engine reports 200ms; user waits 6 seconds. | Bottleneck in external RAG vector retrieval or network gateway. | Measure elapsed time between client HTTP dispatch and inference ingress. | Optimize vector database HNSW indexing; eliminate redundant proxy hops. |
| GPU utilization drops to 0% intermittently during generation. | Host-to-device PCIe bandwidth bottleneck or CPU thread starvation. | Run nvidia-smi dmon to inspect PCIe throughput and GPU SM clocks. | Pin CPU worker threads to local NUMA node; enable GPUDirect storage. |
Always test one variable at a time. Altering model quantization, batch size, and concurrency simultaneously obscures which specific adjustment resolved the bottleneck.
Pro Tip: If Time to First Token (TTFT) spikes on long prompts, enable Chunked Prefill in your serving engine. Chunked prefill breaks massive 16,000-token prompt contexts into smaller chunks (e.g., 512 tokens), interleaving prompt prefill calculations with ongoing decode iterations. This prevents large document extractions from freezing interactive chat streams.
Inspect serving configuration parameters and optimization tradeoffs
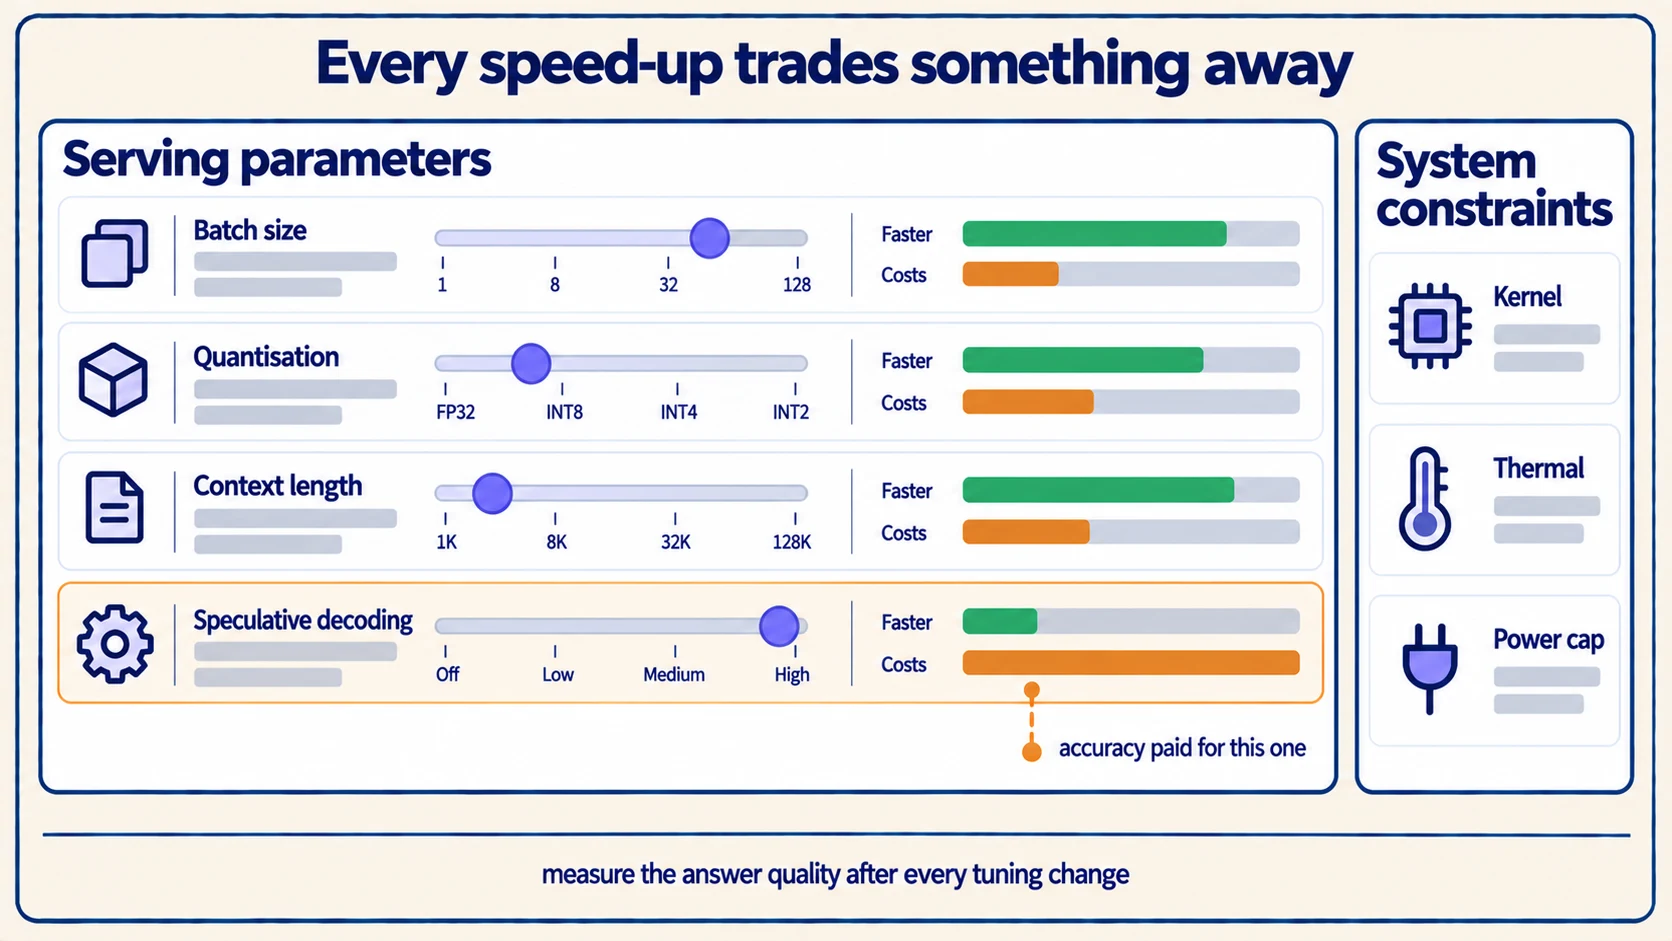
Serving engines expose powerful optimization knobs, but each knob introduces strict engineering tradeoffs.
The vLLM optimization documentation details key configuration parameters:
gpu_memory_utilization: Governs the percentage of VRAM allocated to model weights and the KV cache (default is typically 0.90). If set too high (e.g., 0.98), the engine may crash with out-of-memory errors during CUDA kernel workspace allocations.max_num_batched_tokens: Controls how many tokens can be processed simultaneously across prefill and decode phases. Tuning this parameter balances aggregate throughput against individual stream responsiveness.tensor_parallel_size: Partitions model layers across multiple physical GPUs using high-speed NVLink.
NVIDIA’s TensorRT-LLM performance tuning analysis illustrates how in-flight batching (continuous batching) drastically reduces idle GPU compute cycles compared to static batching, packing newly arriving requests into active execution iterations dynamically.
Hardware and kernel-level performance debugging
In on-premises infrastructure, performance degradation is frequently caused by physical hardware or kernel-level misconfigurations rather than software bugs:
- Thermal Throttling & Power Capping: Check whether physical GPUs are throttling clock speeds due to datacenter cooling failures or misconfigured power limits. Run
nvidia-smi -q -d PERFORMANCE,POWERto verify that GPU core clocks remain at their rated boost frequencies. - PCIe Bus Width Degradation: A GPU seated improperly or experiencing motherboard PCIe bus errors may silently drop from PCIe Gen4 x16 down to PCIe Gen1 x1. This slashes host-to-device memory transfer speeds by 90%, causing massive latency spikes during prompt ingestion. Run
nvidia-smi -q -d LINKto verify bus generation and width. - NUMA Node Imbalance: On dual-socket CPU motherboards, ensure inference container processes are pinned to the specific CPU socket and NUMA node physically wired to the target GPU PCIe lanes. Traversing the CPU interconnect (UPI/QPI) introduces severe latency penalties.
Verify semantic output quality before approving performance tweaks
Every performance optimization carries an inherent risk of degrading model reasoning quality:
- Enabling aggressive 4-bit quantization (AWQ or GPTQ) speeds up token generation, but can impair the model's ability to follow complex JSON extraction schemas or perform multi-step math.
- Truncating input context windows reduces TTFT, but can discard critical document clauses needed for accurate RAG grounding.
For every candidate optimization, rerun your automated golden evaluation suite before deploying to production, as detailed in our guide on self-hosted AI update testing.
Cross-reference your measured performance against the capacity models established in our guide to on-premises AI workload sizing.
To explore model deployment benchmarks across enterprise architectures, consult our Model Hub. When you are ready to evaluate troubleshooting runbooks and serving optimizations against your organization's real-world workloads, schedule an enterprise architecture demo to review live profiling tools and optimization frameworks.