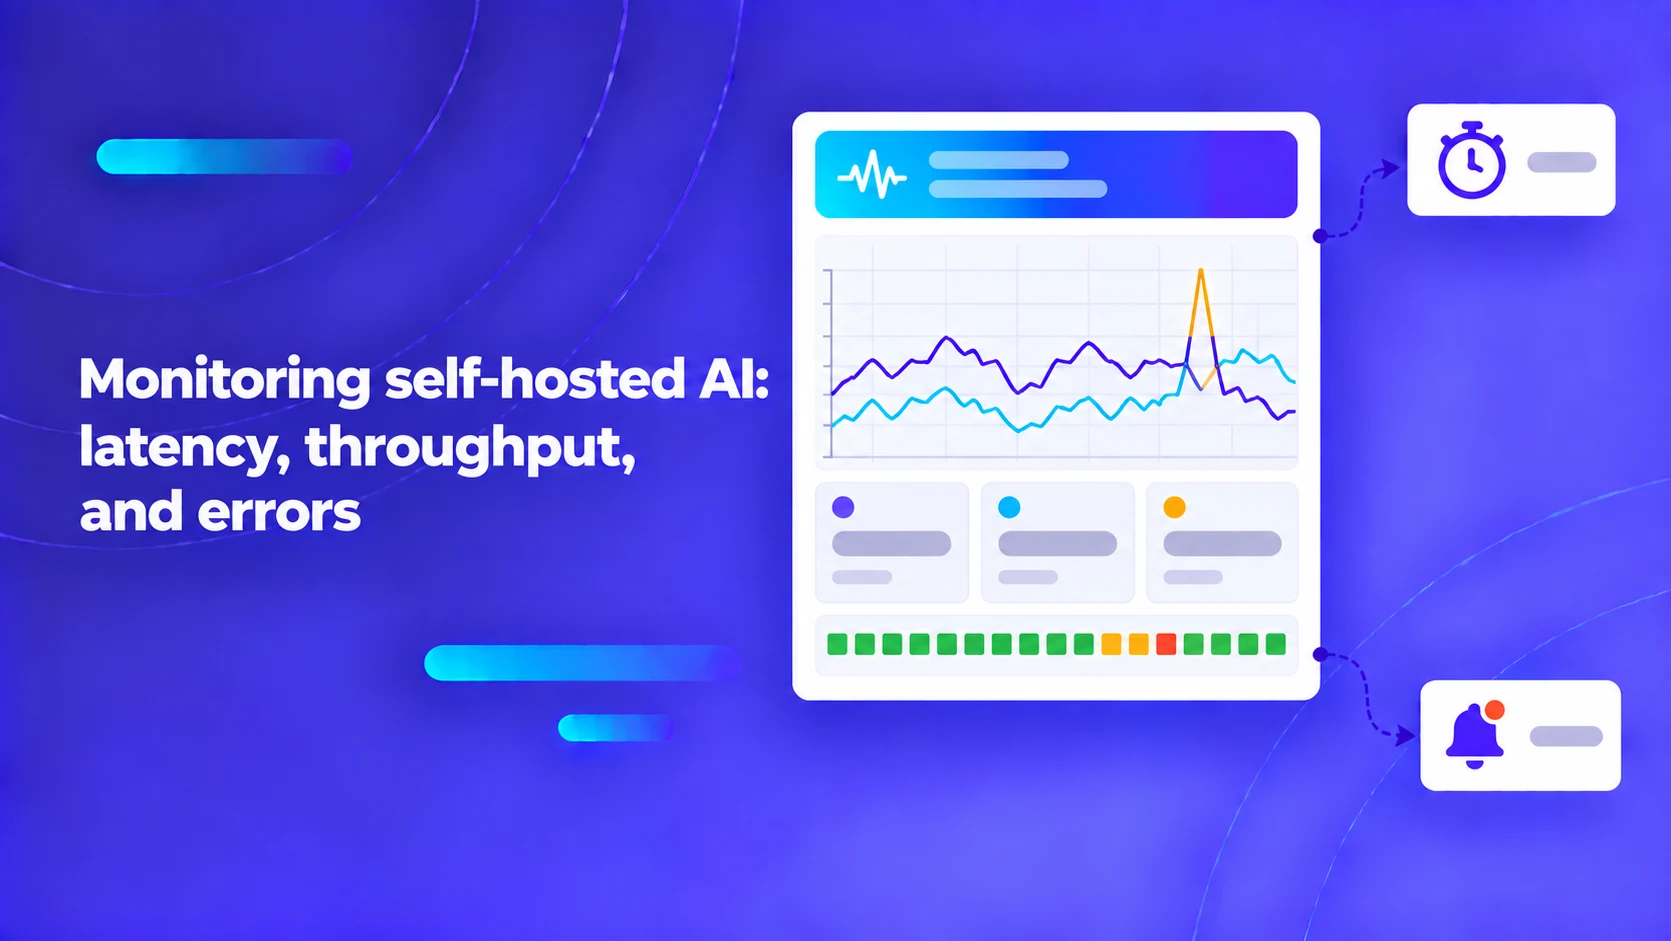
Monitoring self-hosted AI: latency, throughput, and errors
Choose LLM monitoring metrics that separate queueing, first-token delay, generation, failures, and dependency health without collecting unnecessary task content.

Sarath Chandran
A self-hosted AI service can be running while users experience a slow or unusable application. Process health is only the first signal. Useful monitoring shows how requests move through the service, where time accumulates, and whether work is completing.
In traditional web infrastructure, monitoring revolves around standard four golden signals: latency, traffic, errors, and saturation. However, self-hosted generative AI platforms introduce radical operational complexity that breaks conventional APM monitoring tools. A GPU inference server can report 100% healthy HTTP 200 responses and 0% CPU utilization while user requests stall in an internal queue for 90 seconds waiting for KV cache allocation. Conversely, a GPU running at 100% compute utilization may simply be performing an unoptimized, low-throughput prompt prefill rather than delivering responsive tokens. To keep private AI services reliable, platform teams must monitor the complete transaction path across infrastructure, inference runtimes, and semantic quality.
Key Architecture Rule: Decouple infrastructure metrics (GPU temperature, VRAM) from inference engine metrics (prefill latency, decode velocity, KV cache fragmentation) and application pipeline metrics (retrieval time, tool execution). Relying solely on host-level health checks blinds operators to severe application-level degradations.
Follow the complete request path through the distributed stack
Before designing monitoring dashboards or configuring Prometheus alerts, platform architects must map every segment of an inbound inference transaction:
- Ingress & Authentication: Request arrival, API token validation, and rate limit metering.
- Context Assembly & Retrieval (RAG): Query embedding generation, vector database similarity search, and reranking latency.
- Queue Scheduling & Admission Control: Time spent waiting in the inference engine's internal priority queue before gaining access to GPU memory.
- Prompt Prefill Phase (TTFT): Processing the multi-thousand token input prompt through the neural network to generate the first token.
- Autoregressive Decode Phase (ITL): Sequential generation of subsequent output tokens until an end-of-sequence token is reached.
- Post-Processing & Tool Execution: Parsing structured JSON schemas, running regex format checks, or invoking autonomous agent tools.
The Prometheus instrumentation guidance emphasizes tracking request counts, error rates, latency histograms, and in-flight request gauges. Applying these principles to AI workloads requires capturing timestamps at the boundaries between each of these six phases to isolate where latency accumulates.
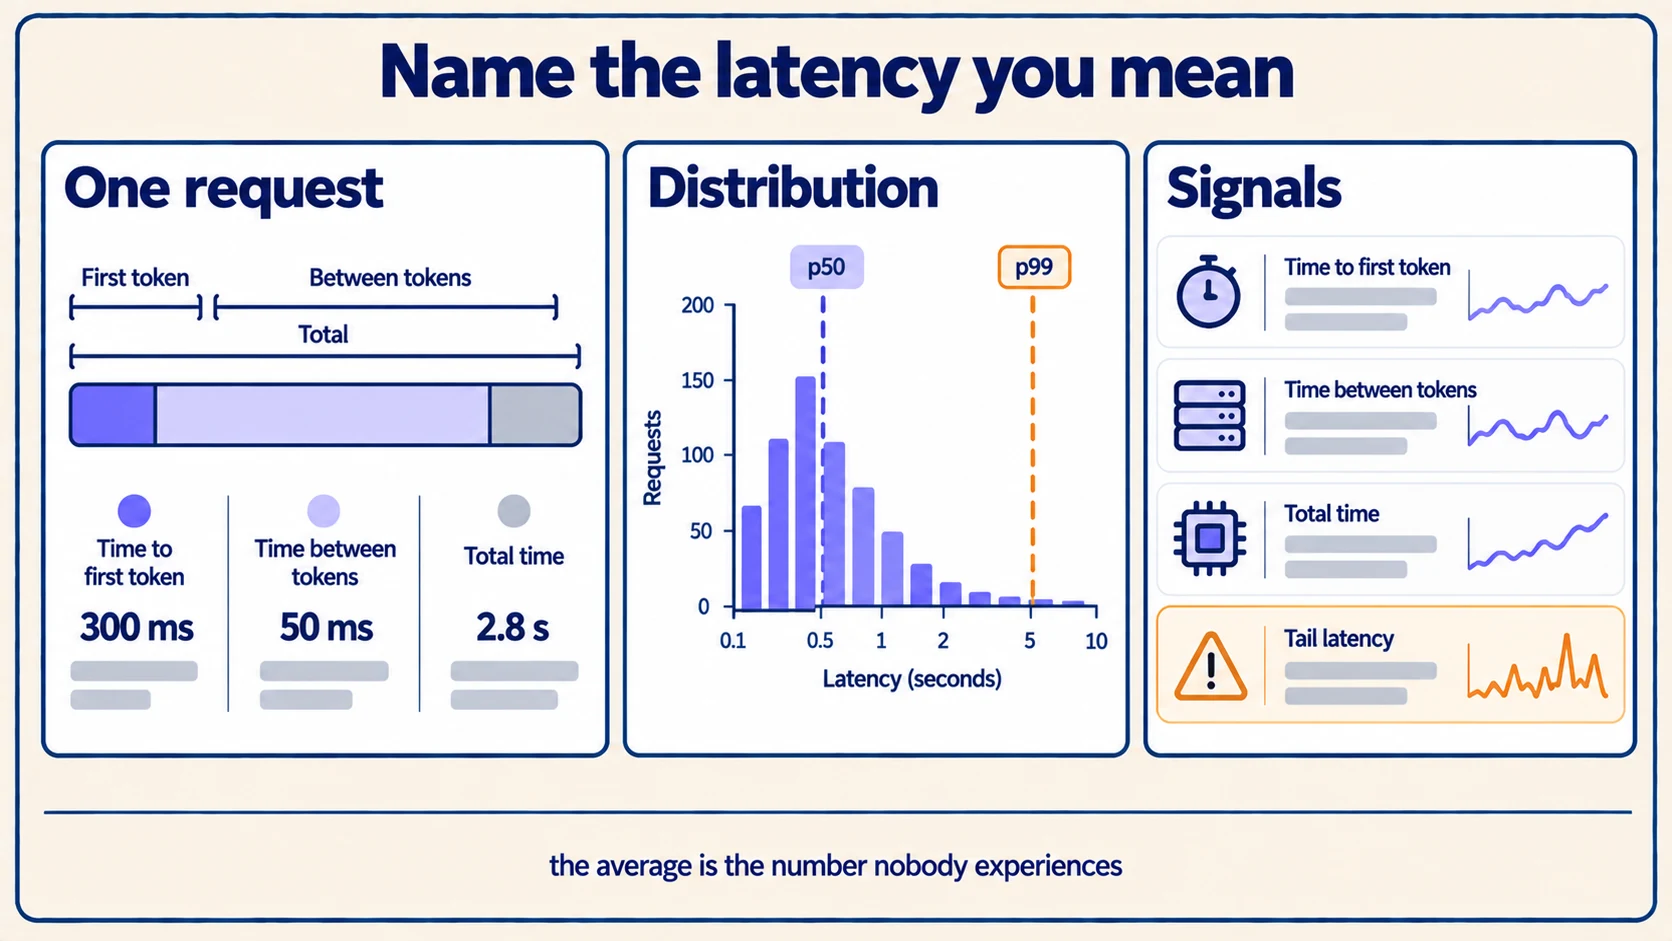
Name and measure latency metrics with mathematical precision
In generative AI operations, vague terms like "response time" create confusion during incident post-mortems. Engineering teams must standardize on unambiguous operational definitions.
The NVIDIA benchmarking metrics reference establishes the four foundational latency metrics for LLM serving:
- Time to First Token (TTFT): The duration from request receipt to the emission of the first generated token. TTFT is dominated by the computational complexity of the prefill phase (attention cost grows roughly with the square of prompt length) plus any queue wait time.
- Inter-Token Latency (ITL): The time elapsed between consecutive emitted tokens during the decode phase. ITL is bound by GPU memory bandwidth, as model weights must be loaded from VRAM for every single generated token.
- End-to-End Latency (E2E): The total duration from initial client dispatch to the final stream closure.
- Generation Throughput: The total tokens produced per second across all active streams on a serving node (tokens per second).
In an interactive conversational assistant, users perceive the system as fast if TTFT is under 800ms and ITL is under 40ms, even if the complete answer takes 10 seconds to finish streaming. In an automated document-processing batch job, TTFT is irrelevant; the only metric that matters is aggregate token throughput.
Pro Tip: In Prometheus histograms, avoid default exponential buckets designed for microservices (e.g., 5ms to 500ms). LLM inference requires custom bucket distributions spanning from 100ms up to 60,000ms to capture long prompt prefills and deep reasoning iterations without truncating upper percentiles.
An illustrative enterprise AI monitoring dashboard
To provide actionable operational visibility, construct a tiered dashboard capturing the full system state. The table below outlines key telemetry signals, their diagnostic purpose, and common interpretation traps. The examples below are deliberately synthetic and illustrative; they do not represent specific vendor benchmarks or product capabilities.
| Telemetry signal | Diagnostic question it answers | Metric type & source | Common interpretation trap |
|---|---|---|---|
| KV Cache Block Utilization | How close is the engine to running out of dynamic attention memory? | Gauge (vLLM / Triton metrics) | 90% utilization is optimal; spikes to 100% trigger request preemption. |
| Waiting Queue Depth | Are requests queuing up outside the GPU due to lack of capacity? | Gauge (Serving scheduler) | A momentary burst is normal; sustained queue growth indicates undersized hardware. |
| P95 / P99 Time to First Token | Are users experiencing long freezes before responses begin? | Histogram (Inference gateway) | High TTFT can be caused by massive RAG context, not slow GPU compute. |
| P95 Inter-Token Latency | Is the conversational stream smooth and readable? | Histogram (Streaming proxy) | Average ITL can look acceptable while individual tokens suffer periodic 2-second stutter. |
| GPU Memory Bandwidth Saturation | Is the memory bus bottlenecked by high concurrency decode? | Gauge (NVIDIA DCGM exporter) | High compute utilization does not mean memory bus saturation. |
| Vector DB Query Latency | Is context retrieval delaying model invocation? | Histogram (Milvus / Qdrant) | Slow retrieval can make the model look slow when the database is the true bottleneck. |
| Tool Execution Error Rate | Are autonomous agent tool calls failing downstream? | Counter (Agent runtime) | Model reasoning may be correct while an internal API connector is returning HTTP 500s. |
Ensure every metric alert maps to an actionable runbook. An alert that fires without a concrete troubleshooting path generates alert fatigue and degrades operational responsiveness.
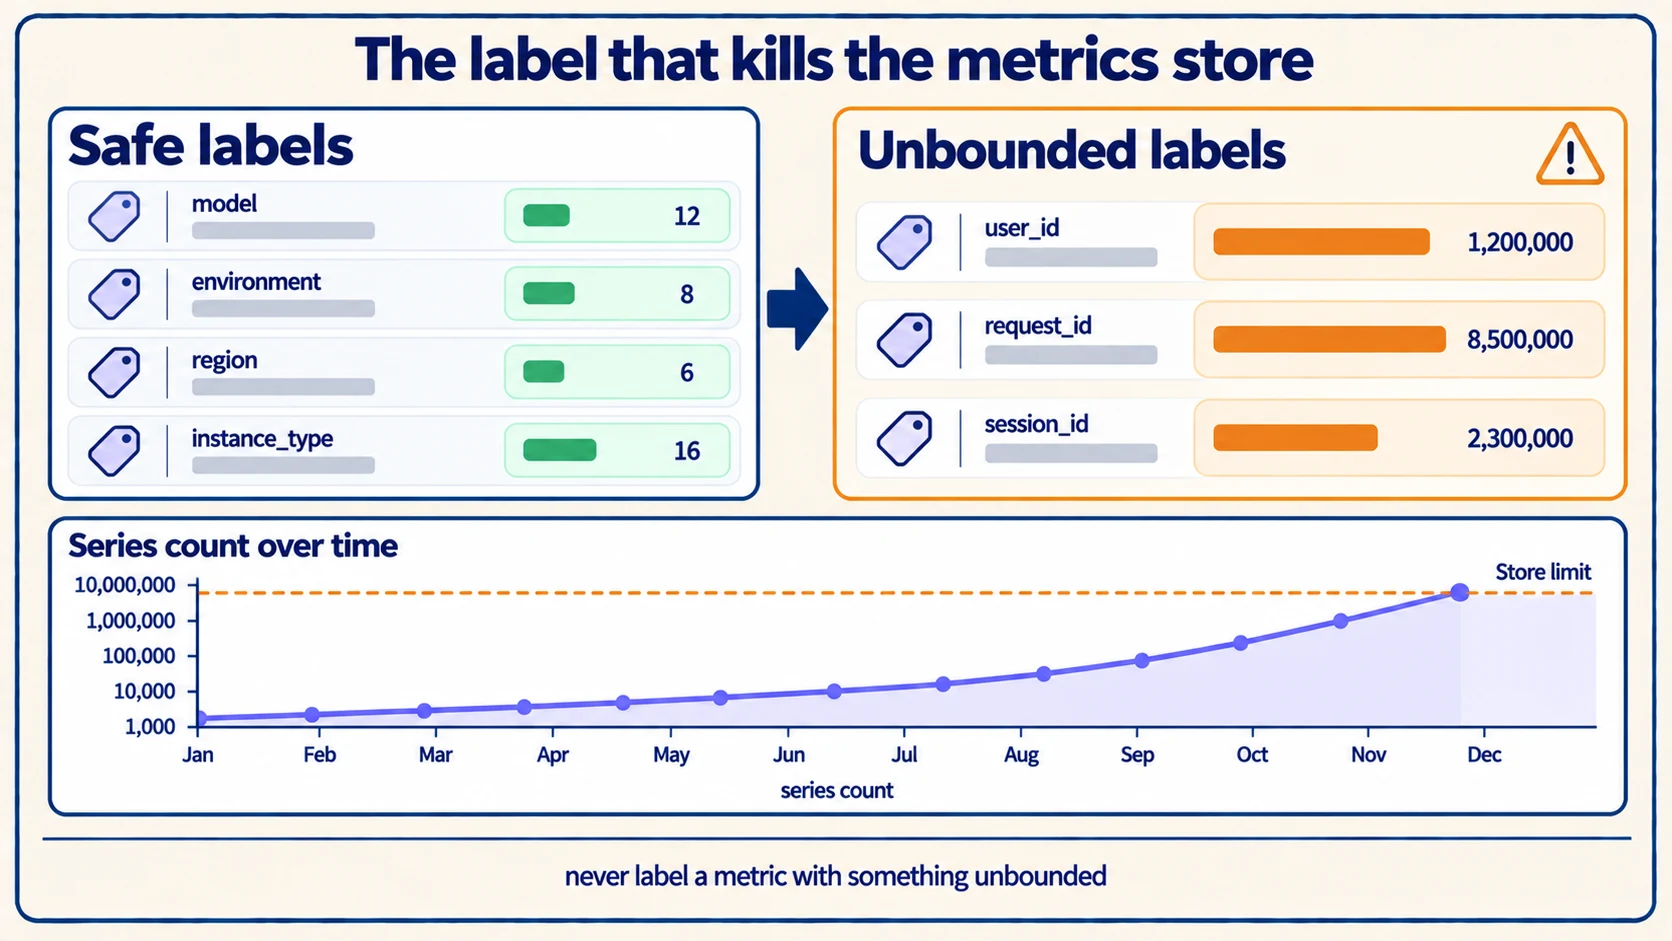
Avoid high-cardinality anti-patterns in metric labels
A frequent operational failure in Prometheus-based AI monitoring is injecting high-cardinality strings into metric labels:
- Never include:
prompt_id,user_id,document_filename, orraw_prompt_textin Prometheus metric labels. - Generating millions of unique metric timeseries will exhaust Prometheus server memory and crash your observability infrastructure.
Instead, restrict metric labels to low-cardinality dimensions:
model_name(e.g.,llama-3-70b-instruct)quantization(e.g.,fp8,awq)endpoint_type(e.g.,chat_interactive,batch_extraction)status_code(e.g.,200,429,500)
Store high-cardinality request context (such as document IDs, token counts, and execution traces) in distributed tracing and log indexing platforms (such as OpenTelemetry, Jaeger, or Grafana Loki) linked by a shared trace_id.
Read multi-signal patterns for root-cause diagnosis
Diagnosing AI platform degradation requires correlating signals across infrastructure and application tiers:
- Pattern A: Queue Depth Growing + High TTFT + Stable ITL: The model is struggling under large prompt prefill bursts. The GPU memory bandwidth is fine, but the compute cores are saturated processing incoming token contexts. Remedy: Implement prompt caching or scale horizontal prefill replicas.
- Pattern B: Low TTFT + High ITL + Maxed KV Cache: The engine accepted too many concurrent requests. The GPU memory bus is thrashing as it swaps attention blocks. Remedy: Reduce max concurrent sequences or enable FP8 KV cache quantization.
- Pattern C: Normal Model Latency + High End-to-End Latency: The bottleneck is outside the inference engine. Inspect vector database retrieval times, external database tool connectors, or client network buffering.
For systematic step-by-step diagnostic workflows, consult our companion guide on self-hosted LLM performance troubleshooting.
Alert on the symptoms users feel, not on resource thresholds
Most AI platform alerting is built from static resource thresholds — GPU utilisation above ninety per cent, queue depth above fifty, memory above eighty per cent. Every one of those fires during healthy operation, because a well-utilised inference cluster is supposed to run hot. Within a month the on-call rotation has muted them, and the observability investment has produced nothing but noise.
Alert instead on the service objective being consumed faster than the period allows. Google's alerting on SLOs chapter sets out the burn-rate approach: if a thirty-day objective permits a given share of bad requests, alert when the current rate would exhaust that budget well before the thirty days elapse.
Two windows are enough for an AI platform:
- A fast window, roughly an hour, at a high burn rate. Catches an outage in progress — a worker pool that has stopped serving, a vector store that has fallen over. It pages.
- A slow window, roughly six hours, at a low burn rate. Catches gradual degradation that never trips a threshold: a model version that made every response slightly slower, or a retrieval index that has quietly grown past its memory budget. It opens a ticket.
Keep resource metrics on dashboards, where they are diagnostic, and off the pager, where they are noise. The exception worth keeping is capacity exhaustion with a long lead time — disk filling on the metrics store, certificates approaching expiry — where the alert is a scheduling prompt rather than an incident.
Monitor whether answers are still good, not only fast
Latency monitoring will not detect the most expensive failure mode a self-hosted platform has: a service that responds quickly and correctly-looking, and answers worse than it did last week. A misconfigured retrieval index, a quantisation change, a truncated system prompt — none of these move a single infrastructure metric.
Five signals track answer quality without any labelled evaluation and without putting user content into metrics:
- Finish-reason distribution. A rising share of length-capped completions means answers are being cut off mid-sentence. This is a one-line change to emit and it catches context-window regressions immediately.
- Retrieval hit rate and score distribution. The share of queries returning at least one chunk above the relevance floor, and how those scores are distributed. A downward shift means the index has drifted, and it precedes user complaints by days.
- Response length distribution. A sudden collapse in median response length is the classic signature of a truncated or malformed system prompt after a deployment.
- Regeneration and retry rate. Users asking the same question again is the most direct quality signal available, and it costs nothing to collect because the application already knows.
- Structured-output parse failure rate. For extraction and agent workloads, the share of responses that fail schema validation. It moves sharply on a model version change and is the fastest way to catch a bad rollout.
Pro Tip: Record the model version, quantisation format and serving engine version as labels on the latency and quality metrics, then require a deployment to be visible on the dashboard as an annotation. Most unexplained regressions become explicable in seconds once you can see that the curve moved at the same moment something shipped.
Treat traces as regulated data, not as debug output
The standard resolution to the cardinality problem — put the high-cardinality context in traces and logs — creates a governance problem that is easy to miss. Metrics are aggregates and carry nothing sensitive. Traces of an AI request frequently carry the prompt, the retrieved chunks and the completion, which is to say the most sensitive content moving through the platform, now duplicated into an observability stack with its own retention, its own access control and often its own storage location.
Four decisions that belong in the design rather than in a later remediation:
- Decide what a span may carry. Token counts, chunk identifiers, document IDs and durations are almost always safe. Prompt text, retrieved passages and completions almost always are not. The OpenTelemetry tracing model makes attribute-level control straightforward — the difficulty is agreeing the policy, not implementing it.
- Apply the same residency rule as the primary data. A sovereign deployment whose traces ship to a managed observability service in another jurisdiction has moved regulated content across the boundary the deployment exists to enforce.
- Set retention deliberately. Traces are most valuable in the first few days and become a liability afterwards. A short window for full payloads and a long window for the metadata serves both needs.
- Access-control the trace store as a data system. Anyone who can read traces can read the content of user conversations, which is a broader grant than "the platform team can debug the platform" and should be made knowingly.
Record a baseline before you need one
Every diagnostic pattern in the previous section compares current behaviour to normal behaviour, and normal has to be written down somewhere. Teams that skip this step spend the first hour of an incident arguing about whether a number is unusual.
Capture a baseline on a fixed synthetic workload after every significant change — model version, quantisation, serving engine, hardware, or a major shift in prompt structure. Record the percentiles rather than the means, run it at a realistic concurrency rather than one request at a time, and keep the results alongside the configuration that produced them. It takes an hour to set up and it converts the question "is this bad?" from a judgement call into a lookup.
Cross-reference your monitoring baselines against the hardware sizing profiles established in our guide to on-premises AI workload sizing.
Ensure your monitoring and logging daemons comply with enterprise privacy boundaries, avoiding unauthorized telemetry egress as detailed in our guide to on-premises AI outbound data flows.
To learn how our platform integrates comprehensive observability, explore ExemplaryAI’s sovereign deployment options and schedule an enterprise architecture demo to review production telemetry dashboards and alerting frameworks.