On-premises AI privacy: which data still leaves your network?
Map model calls, telemetry, downloads, tools, identity, and support traffic to determine what an on-premises AI deployment actually sends outside its boundary.

Sarath Chandran
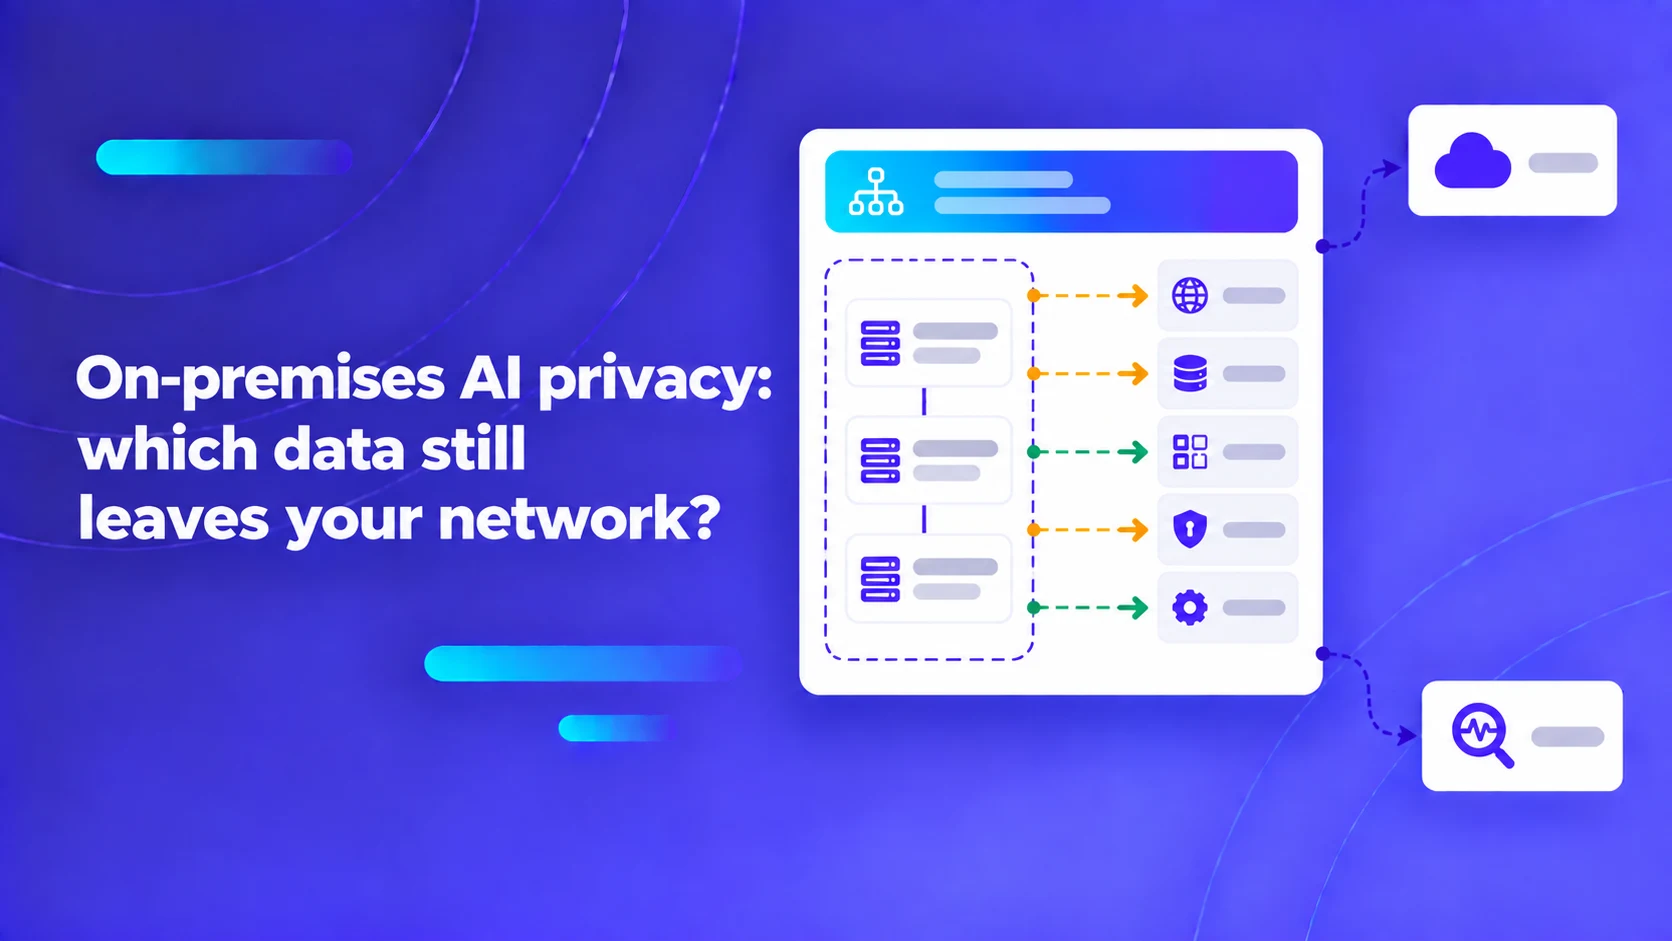
Running an AI application on your own servers does not, by itself, prove that every data flow stays there. Model downloads, remote inference endpoints, integrations, telemetry, identity services, and support tools can each create separate network paths.
In heavily regulated sectors—such as banking, healthcare, government defense, and enterprise legal services—security officers frequently mandate "on-premises" hosting under the assumption that physical server control guarantees total data privacy. However, modern containerized software architectures and AI platforms are intricately interconnected. An application can reside physically on a server rack inside a private corporate data center while quietly routing user prompts to a cloud inference endpoint, transmitting document snippets to a SaaS embedding provider, sending diagnostic stack traces to an external monitoring vendor, or checking license tokens against a remote vendor server.
Key Architecture Rule: Never conflate physical server location with cryptographic and network boundary isolation. A comprehensive data-flow audit must account for three independent architectural layers: the physical compute execution tier, the data processing runtime, and the Layer 4/Layer 7 outbound egress routing perimeter.
Disentangle application location, processing boundaries, and network egress
To conduct a meaningful security review, cybersecurity and compliance architects must decouple three distinct operational assertions:
- Application & Orchestration Location: The physical or virtual infrastructure where the agentic framework, UI frontend, and orchestration middleware run (e.g., internal Kubernetes cluster, private VMware vSphere, or on-premises bare metal).
- Model Processing & Inference Boundary: The exact compute hardware where model weights reside and matrix mathematical calculations execute. If an on-premises application calls an external REST API for LLM inference, the data processing boundary resides in the public cloud, regardless of where the frontend sits.
- Network Egress & Transport Connectivity: The external endpoints, proxy gateways, and DNS resolvers that system services are permitted to reach across the perimeter firewall.
A hybrid deployment may intentionally keep relational databases on-premises while routing non-sensitive tasks to a cloud model through an authenticated forward proxy. Alternatively, a sovereign enclave may mandate that both the application and the inference runtime execute entirely on air-gapped local GPUs. Both designs can be valid, but neither should be obscured beneath a generic "self-hosted" or "on-premises" marketing label.
For foundational architectural planning on setting perimeter boundaries, consult our private AI deployment planning guide.
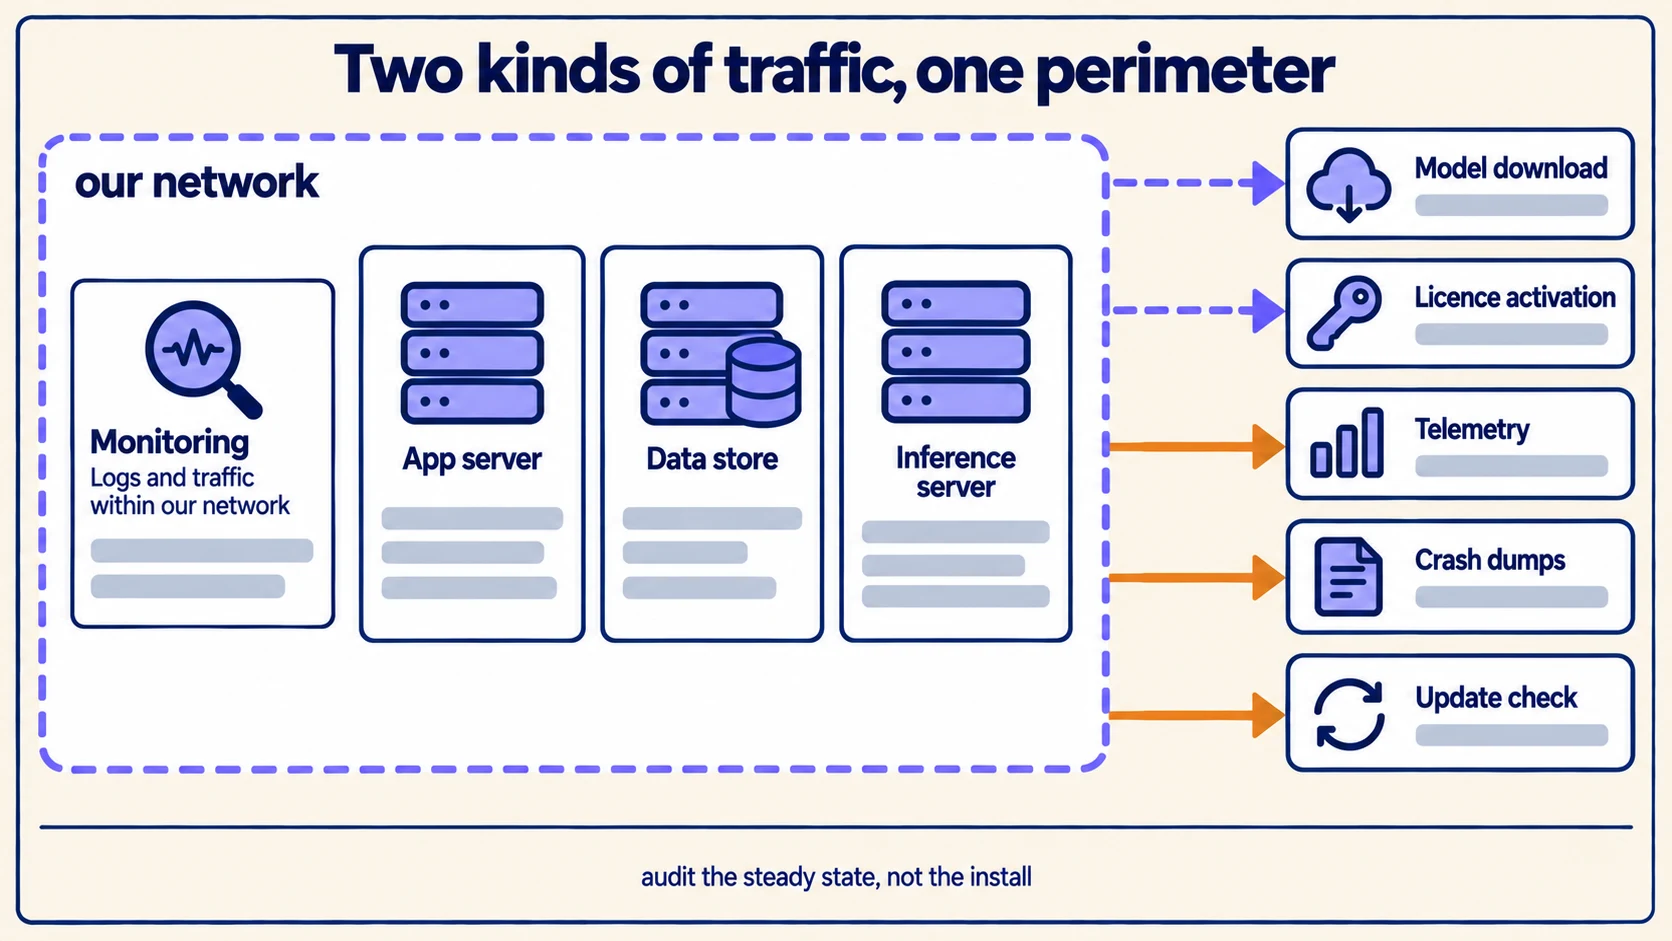
An illustrative enterprise outbound-flow inventory
To audit an on-premises AI deployment effectively, platform engineering teams must construct an exhaustive inventory of all network flows originating from every microservice in the cluster. The table below illustrates an enterprise flow inventory across key architectural tiers. The examples below are deliberately synthetic and illustrative; they do not represent specific vendor configurations or benchmark claims.
| Connection class | Trigger event & frequency | Inherent payload risk | Target endpoint & protocol | Verification & auditing method |
|---|---|---|---|---|
| Model Weight Registry | Cold deployment or model upgrade. | High: Transmits tenant license keys and model identifiers. | Hugging Face Hub, NVIDIA NGC (HTTPS / 443). | Pinned container digests; inspect image pull logs in CI/CD. |
| Model Inference API | Per-user prompt or scheduled agent job. | Critical: Transmits raw prompt text, PII, and document context. | Cloud Model APIs (OpenAI, Anthropic, Vertex AI) (HTTPS / 443). | Egress firewall drop rule; deep packet inspection on proxy. |
| Vector Embedding Service | Document ingestion or RAG search query. | Critical: Transmits raw textual chunks and semantic embeddings. | SaaS Embedding Providers (HTTPS / 443). | Verify local embedding models (e.g., BAAI/bge or E5) on local GPUs. |
| Third-Party Agent Tool | Autonomous agent action execution. | High: Transmits business records, query params, or updates. | Salesforce, GitHub, Slack, SAP APIs (HTTPS / 443). | Inspect Model Context Protocol (MCP) server routing logs. |
| Product Telemetry | Periodic heartbeat (e.g., hourly or daily). | Moderate: Software version, active user counts, license usage. | Vendor Telemetry Gateway (HTTPS / 443). | Sample JSON payload; verify vendor opt-out configuration. |
| Identity & Authentication | User login and hourly token renewal. | High: User emails, group memberships, authorization claims. | Okta, Entra ID, Auth0 (HTTPS / 443 / OAuth2). | Audit token exchange; test local LDAP / Keycloak fallback. |
| Crash & Diagnostic Logging | Uncaught exceptions or kernel panics. | High: Stack traces containing memory dumps or prompt fragments. | Sentry, Datadog, or vendor support endpoints (HTTPS). | Review log scrubbing rules; force local-only log ingestion. |
Add destination ownership, protocol, frequency, business purpose, and the person responsible for approving each flow. A hostname list alone does not explain why a connection exists or whether it is acceptable.
Distinguish initial deployment traffic from steady-state runtime traffic
Security teams often run short 15-minute network scans during an initial proof-of-concept demonstration and conclude that an application makes zero external calls. However, external network requests occur along distinct operational cadences:
- Bootstrap & Installation Egress: Image downloads, OS package updates (
apt,pip), initial model weight pulls, and database migrations. - Steady-State Runtime Egress: Live inference calls, vector queries, database syncs, and agent tool execution.
- Periodic Scheduled Egress: Daily license token verification, nightly telemetry reporting, and weekly certificate revocation list (CRL) polling.
- Failure & Recovery Egress: Unhandled exception reporting to external crash telemetry daemons (such as Sentry) and automatic cloud failover attempts.
Hugging Face’s documentation on offline and telemetry environment variables highlights that disabling telemetry requires setting explicit variables (HF_HUB_DISABLE_TELEMETRY=1) distinct from offline caching variables (HF_HUB_OFFLINE=1).
Similarly, NVIDIA’s air-gap deployment architecture emphasizes that asset preparation in a connected DMZ must be completed before transferring sealed artifacts into isolated enclaves.
Pro Tip: In enterprise Kubernetes clusters, deploy strictNetworkPolicyobjects that default toegress: [](deny all outbound egress) across all AI workloads. Explicitly whitelist only approved internal DNS, database, and local inference service endpoints.
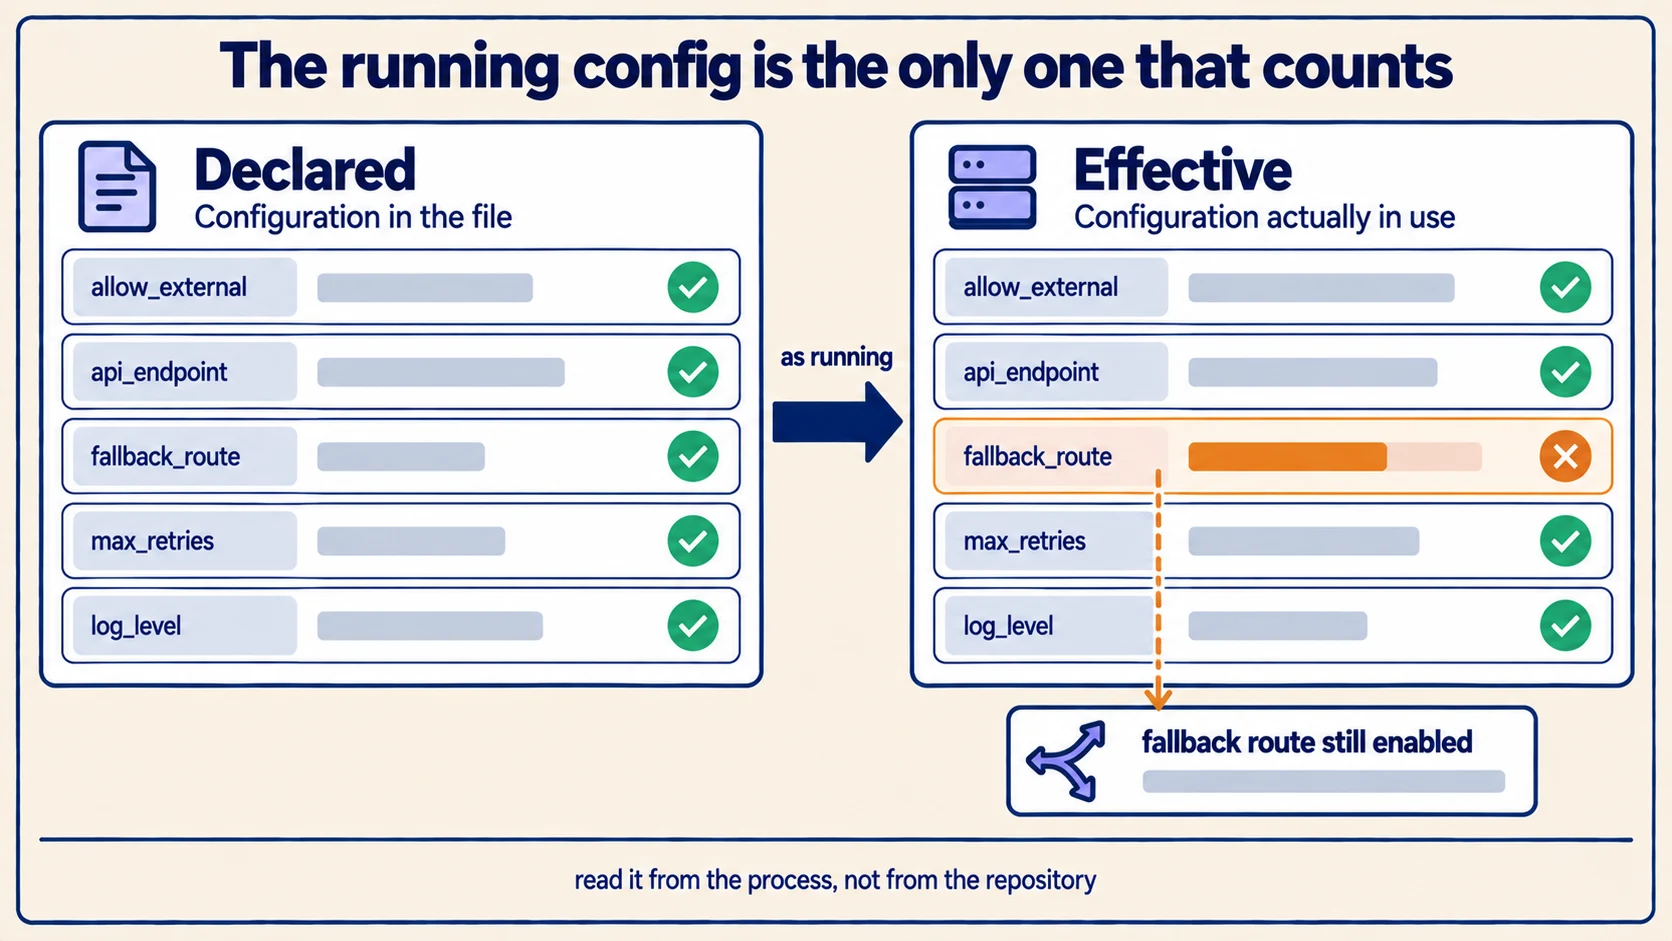
Inspect effective runtime configuration and hidden failover traps
A high-level architectural diagram rarely captures the nuanced behavior of microservices in production. Security auditors must inspect the actual running environment variables, configuration maps, and network routing tables:
- Silent Cloud Fallback Vulnerabilities: Some open-source and commercial orchestration frameworks feature automated fallback logic: if a local GPU inference worker is overloaded or crashes with an Out-of-Memory (OOM) error, the framework automatically forwards the prompt to a public cloud API to prevent user interruption. In an enterprise handling sensitive intellectual property, this "helpful" fallback constitutes an immediate security breach. Ensure all external API keys are omitted and cloud fallback paths are permanently disabled.
- Reverse Proxy Masking: A locally configured hostname (such as
https://ai.internal.corp/v1) may simply act as an internal forward proxy routing traffic to an external cloud model. Tracing network hops through internal proxies to the final external IP is necessary to establish true data sovereignty. - Telemetry in Upstream Open-Source Libraries: Foundational machine learning packages frequently contain opt-out rather than opt-in telemetry beacons that ping external servers on startup to track library usage statistics.
When selecting and deploying models across your infrastructure, use our Model Hub to review supported architectures, local serving footprints, and boundary specifications.
A reproducible network audit protocol using eBPF and packet capture
To establish cryptographic proof of zero unauthorized data egress, execute a structured network audit in an isolated staging sandbox:
- Deploy in Monitored Enclave: Spin up the complete on-premises AI stack within a monitored virtual network segment.
- Attach Kernel-Level eBPF Probes: Deploy extended Berkeley Packet Filter (eBPF) tracing agents (such as Cilium Tetragon) or run low-level packet capture (
tcpdump -i any -w audit.pcap). Kernel-level monitoring captures egress traffic even if an offending application bypasses standard user-space proxy configurations. - Execute Comprehensive User Workloads: Ingest multi-page PDFs, run RAG document searches, trigger agentic multi-tool workflows, and execute code generation queries.
- Trigger Component Restarts & Token Expirations: Simulate container crashes, restart services, and force authentication token expirations to observe recovery network behavior.
- Inspect DNS Resolution Logs: Analyze every DNS query emitted by the cluster. Identify any queries resolving public domain names or external subnets.
- Enforce Firewall Blackhole: Blackhole all external traffic at the edge router (
0.0.0.0/0 -> DROP) and verify that all core application capabilities continue operating without failure or latency degradation.
Treat diagnostic logs and crash dumps as sensitive data assets
Operational log files and diagnostic dumps frequently represent an overlooked data exfiltration vector. When a machine learning pipeline fails, developers often enable "DEBUG" logging. Under debug logging, application servers routinely print full prompt texts, system instructions, retrieved document snippets, and bearer tokens directly to standard output (stdout).
If container logs are forwarded to an external cloud logging SaaS or exported in unredacted support tickets, confidential enterprise data leaves the perimeter.
To protect diagnostic streams:
- Mandate Automated PII Scrubbing: Configure internal log forwarders (e.g., FluentBit or Vector) with regular expression scrubbing filters to mask credit card numbers, social security identifiers, and API keys before writing to log stores.
- Establish Air-Gapped Support Runbooks: Prohibit the direct upload of raw log bundles to external vendor portals. Require human security review and automated redaction prior to transferring any diagnostic bundle across the perimeter.
Review our technical guide on AI agent integrations without internet access to audit how autonomous tools interface with internal network resources inside disconnected enclaves.
To evaluate how our architecture ensures strict boundary isolation, discover ExemplaryAI’s sovereign deployment options and secure File store. When you are ready to review data boundaries and network audit protocols with our engineering team, schedule an enterprise architecture demo to evaluate secure on-premises AI configurations tailored to your compliance perimeter.