High availability for private AI: finding single points of failure
Map the model service, databases, storage, queues, and network dependencies that determine whether a private AI application survives a component failure.

Sarath Chandran
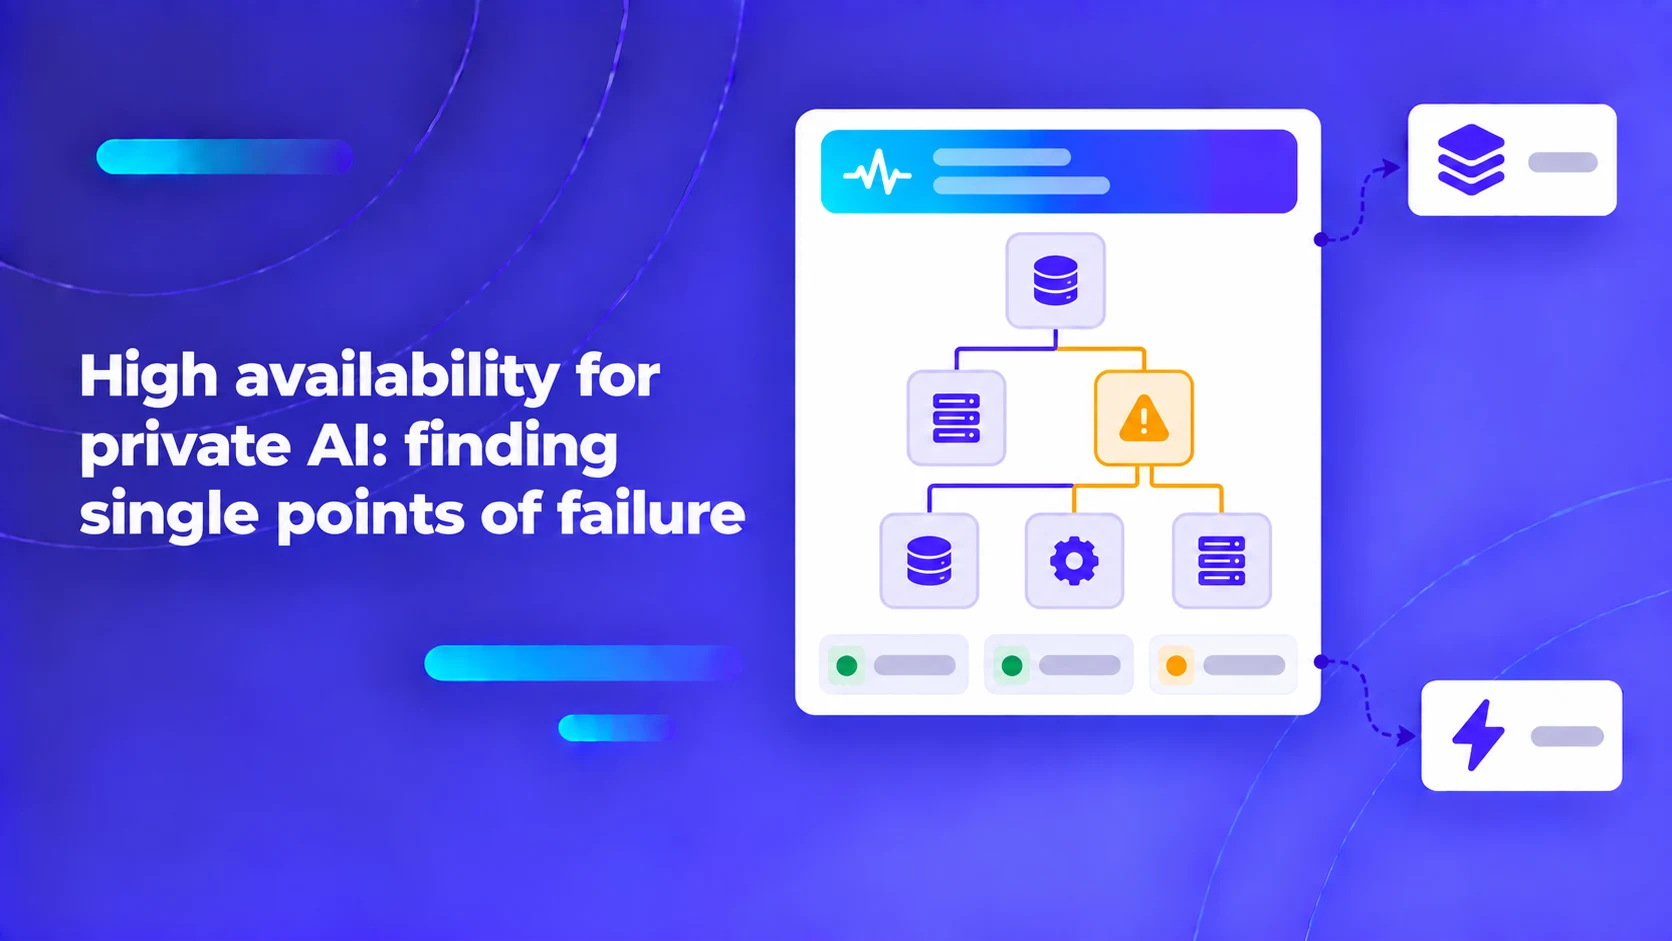
High availability for private AI depends on the whole application path. A second model server will not keep the service usable if every request still depends on one database, one storage system, or one network gateway.
In mission-critical enterprise environments—such as clinical triage, financial fraud detection, emergency response dispatch, and autonomous industrial operations—downtime is unacceptable. When planning high availability (HA) for generative AI, infrastructure teams frequently make the mistake of assuming that provisioning multiple GPUs automatically delivers redundancy. However, AI architectures introduce unique availability challenges: streaming Server-Sent Events (SSE) connections that cannot be re-routed mid-stream without terminating user sessions, multi-minute cold model loading times, massive Key-Value (KV) cache memory constraints, and complex state synchronization across vector stores and relational databases.
Key Architecture Rule: High availability is a holistic end-to-end property of the entire transaction path. True redundancy requires eliminating single points of failure across ingress load balancers, application microservices, GPU inference replicas, relational databases, object stores, and identity providers.
Define the specific failure domains your architecture must tolerate
Before configuring load balancers or provisioning failover hardware, engineering teams must define what failure modes the system is designed to survive:
- Inference Worker Process Crash: An individual model serving container crashes due to an out-of-memory (OOM) tensor allocation or segmentation fault.
- Physical Node Hardware Failure: A physical bare-metal GPU server experiences a motherboard failure, power supply failure, or thermal PCIe bus shutdown.
- Storage & Database Outage: A primary relational database, vector database node, or object storage cluster becomes temporarily unreachable.
- Network Partition / Switch Failure: A top-of-rack (ToR) network switch fails, isolating an entire server rack within the datacenter.
- Planned Maintenance Disruption: Operating system kernel updates, NVIDIA driver patches, or Kubernetes node drain operations.
Crucially, distinguish between accepting new user requests and preserving in-flight generations. When a GPU worker crashes mid-generation, an active streaming HTTP token stream is severed. An HA architecture must handle this gracefully: the client UI must detect the dropped connection, re-submit the conversational context to an alternate healthy replica, and resume generation without requiring the user to refresh the browser.
Map single points of failure across the complete transaction path
To audit an enterprise AI platform for high availability, trace every hop of an inbound inference request. The table below outlines potential single points of failure across the AI transaction lifecycle. The examples below are deliberately synthetic and illustrative; they do not represent specific vendor benchmarks or product capabilities.
| Architectural component | Single Point of Failure (SPOF) risk | Required redundancy & failover mechanism |
|---|---|---|
| Ingress Gateway / Load Balancer | Single hardware router or unclustered reverse proxy. | Active-Active HAProxy / NGINX cluster with Keepalived and Anycast BGP routing. |
| Agent Middleware / Web Tier | Single application container instance. | Horizontally autoscaled stateless pods behind Kubernetes Service abstractions. |
| Model Serving Engine | Single GPU worker or un-replicated serving pod. | N+1 independent model replicas distributed across distinct physical hypervisors. |
| Relational Database | Single primary PostgreSQL instance. | Primary-Replica streaming replication with automated Patroni / pg_auto_failover. |
| Vector Search Engine | Single Milvus or Qdrant standalone instance. | Clustered vector database with distributed coordinator, query nodes, and raft consensus. |
| Document Object Store | Single local disk mount or standalone NAS. | Distributed, erasure-coded object storage (e.g., MinIO or Ceph) spanning distinct racks. |
| Identity & Authentication | Single local LDAP or Keycloak instance. | Clustered identity providers with replicated backends and cached session tokens. |
Assign operational ownership for each tier and ensure failure domains do not overlap. Running two virtual machines on the same physical server or attaching both to the same network storage array provides zero hardware redundancy.
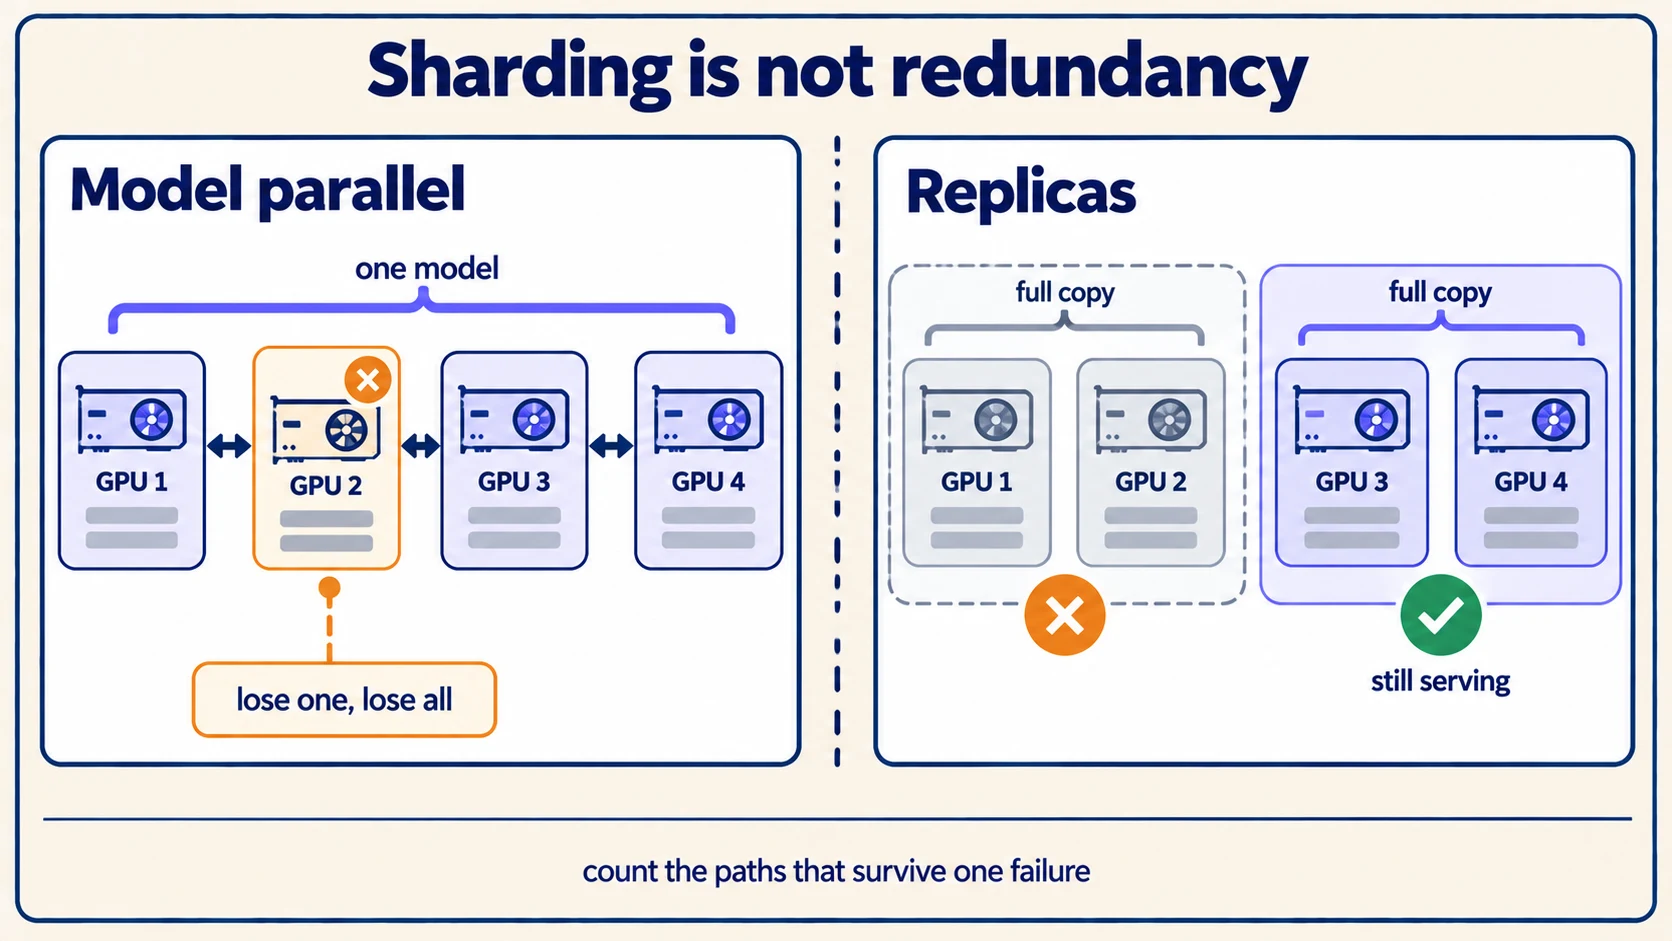
Model parallelism across GPUs is not replica redundancy
A frequent and dangerous misconception in AI infrastructure planning is conflating Model Parallelism with Service Redundancy:
- Tensor Parallelism (TP) & Pipeline Parallelism (PP): When a 70B parameter model is partitioned across four 24GB GPUs (e.g.,
TP=4), all four GPUs act as a single, tightly coupled distributed computer. If any one of those four GPUs overheats, crashes, or suffers an ECC memory error, the entire serving instance crashes immediately! - Horizontal Model Replicas: High availability requires deploying a completely independent second group of four GPUs running an identical model instance behind a round-robin or least-connections load balancer.
NVIDIA’s multi-node deployment architecture documentation explains how tensor and pipeline parallelism split one model across the GPUs of several nodes, linked by high-speed InfiniBand or RoCE networking. Understanding this distinction is vital: distributing weights across multiple devices solves memory capacity limitations, but does not provide fault tolerance.
Pro Tip: In Kubernetes GPU clusters, configure custom readiness probes that verify model availability via lightweight dummy inference tokens (/health/ready), not simple HTTP port checks. A GPU serving container may bind its HTTP port within 2 seconds of launch, but remain completely incapable of serving inference for 4 minutes while loading 80GB of model weights into VRAM.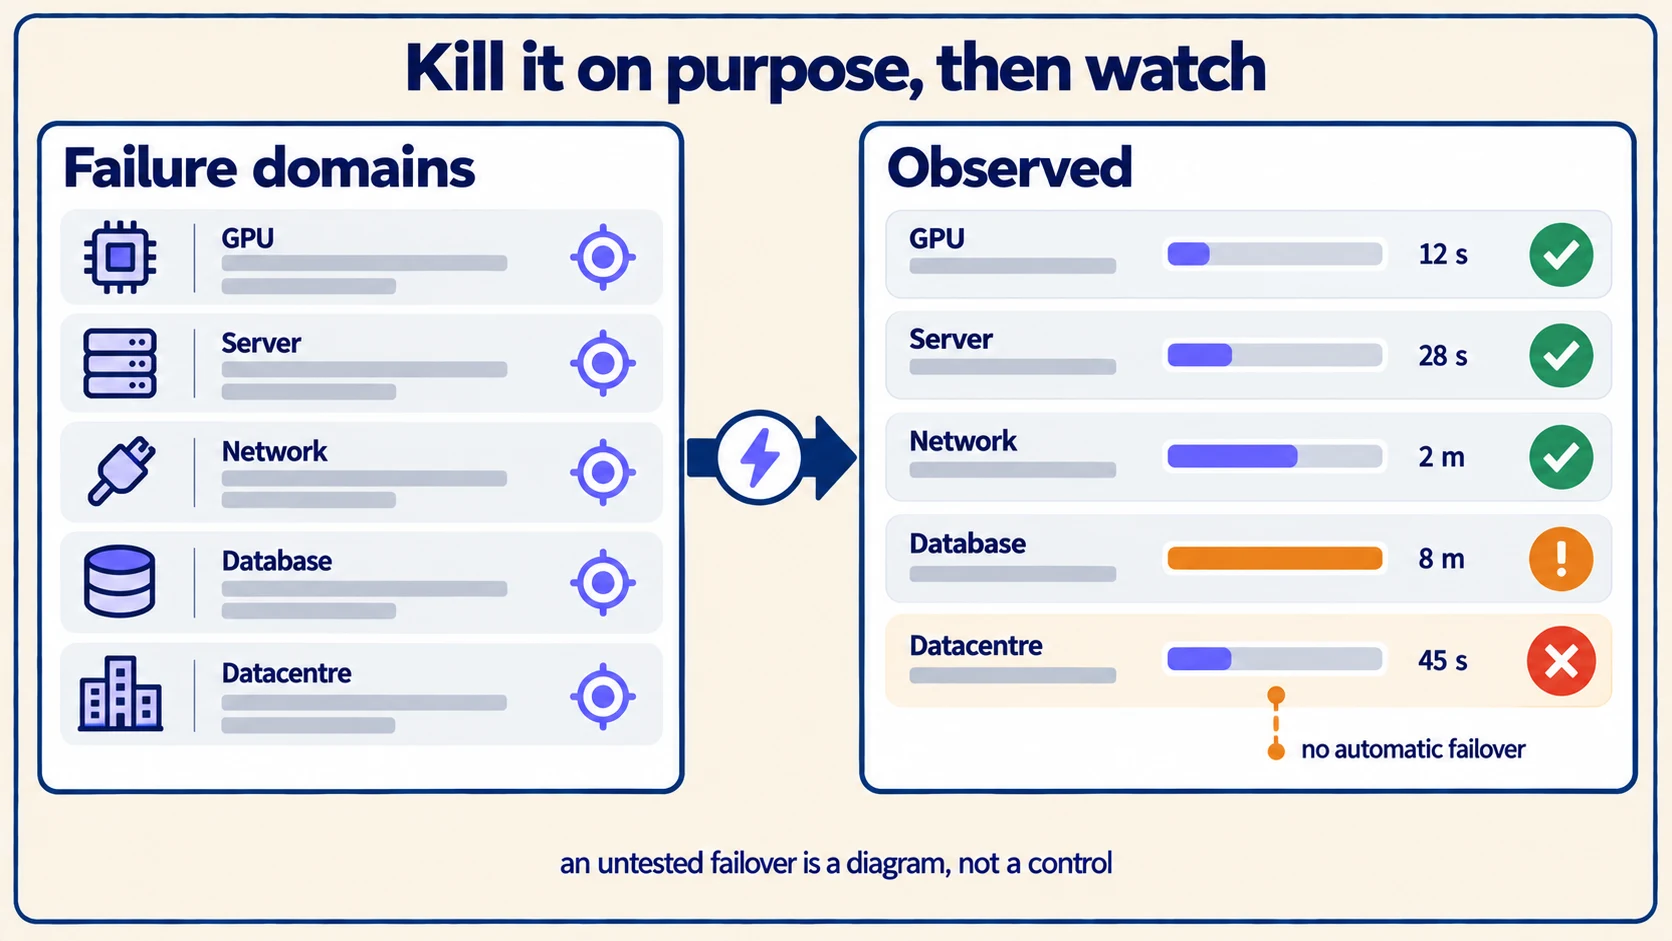
Plan reserve capacity for degraded-mode operations
True high availability requires planning for performance degradation when a node fails. If your normal daytime peak workload consumes 85% of your GPU compute capacity, losing one node in an N+1 cluster will push the surviving nodes past 100% capacity:
- The Cascading Collapse Trap: When remaining nodes become overwhelmed, incoming requests queue up. As queue wait times exceed client timeouts, users hit "refresh," submitting duplicate requests that compound the bottleneck, triggering memory exhaustion and crashing surviving nodes.
- Graceful Degradation & Backpressure: Implement proactive request admission control (such as token bucket rate limiting and priority queues). Under failover conditions, prioritize interactive user queries over background batch document-processing jobs.
Review our in-depth guides on on-premises AI workload sizing and private AI total cost of ownership to calculate the financial balance between reserve hardware headroom and operational failover requirements.
Handle planned maintenance with Pod Disruption Budgets
Unplanned hardware failures represent only a fraction of service interruptions; routine maintenance (security patching, Kubernetes upgrades, and host hardware servicing) accounts for the vast majority of downtime.
Kubernetes PodDisruptionBudget (PDB) documentation outlines how declarative policies ensure a minimum number of healthy replicas remain available during voluntary disruptions:
- Set
minAvailable: 1ormaxUnavailable: 1on model serving deployments. - When an operator executes
kubectl drain node, Kubernetes ensures the replacement model replica on another node has completely loaded its weights and passed its readiness probe before terminating the old pod.
Write the availability target as a number someone signed off
"Highly available" is not a specification. Without a target, every design decision becomes a matter of taste and every outage becomes an argument about whether the system behaved acceptably.
Three annual availability targets, and what each actually costs in downtime:
| Target | Downtime per year | Downtime per month | What it implies |
|---|---|---|---|
| 99.0% | ~3.65 days | ~7.3 hours | Single region, manual failover, business-hours on-call |
| 99.9% | ~8.8 hours | ~44 minutes | Automatic failover, redundancy at every tier, 24/7 paging |
| 99.99% | ~53 minutes | ~4.4 minutes | Multi-site, automated remediation, no manual step in the recovery path |
The jump from the second row to the third is where cost becomes non-linear, and it is rarely justified by the workload. A little under an hour of unplanned downtime a year leaves no budget for a human to read an alert, form a hypothesis and act — every recovery must be automatic, and every automation must itself be tested, which is a standing engineering commitment rather than a hardware purchase.
Set the target per request class rather than for the platform as a whole. An interactive assistant used by a trading desk and an overnight batch summarisation job do not need the same guarantee, and pretending they do means either over-building the batch path or under-building the interactive one.
Define what "available" means for a streaming endpoint
Conventional availability monitoring counts HTTP status codes, and that measure is close to useless for token streaming. A request that returns 200 OK, emits four tokens and then dies when its worker is evicted is recorded as a success. The user saw a broken answer.
Define availability in terms the user would recognise:
- Time to first token, with a threshold. A response that begins after ninety seconds is not available in any sense the user cares about, however healthy the status code. Track TTFT at the 95th and 99th percentiles, not the mean, since the mean hides exactly the failures that drive complaints.
- Stream completion rate. The share of streams that reach their natural stop rather than terminating early. This is the number that moves during a failover and the one conventional monitoring cannot see.
- Session-level success. Whether the user got an answer, counting a transparent client-side retry as a success and a visible error as a failure. This is the honest measure, and it is usually several points below the request-level number.
An architecture that transparently resumes a severed generation against a healthy replica can post a very high session success rate on top of a mediocre request success rate. That gap is the value the retry layer is delivering, and it only becomes visible once both are measured.
Decide how state survives a failover
Redundancy at the compute tier is straightforward because inference workers are stateless between requests. Everything that is not stateless is where failovers actually go wrong.
Four kinds of state, in rough order of how often they are overlooked:
- KV cache. It is per-worker, in GPU memory, and unrecoverable. A failover always means recomputing the prefill for the resumed request, which is why a resumed long-context generation costs materially more than the original and why retry storms are expensive as well as slow.
- Conversation history. If it lives in worker memory, a failover loses the conversation. It belongs in the shared database from the first request, not flushed at the end of a session.
- Vector index state. A clustered vector store that is still rebalancing after losing a node can serve degraded results rather than errors — the query succeeds and returns worse matches. This is silent, and it needs a recall check against a fixed probe set rather than a health endpoint.
- Session affinity. Sticky sessions make cache hit rates look excellent and turn a single worker loss into a total outage for every user pinned to it. Prefer a shared prefix cache to affinity where the serving engine supports it, and where affinity is unavoidable, cap how much state a single worker is allowed to own.
Pro Tip: Measure recovery in terms of when the replacement replica can serve, not when the scheduler places it. A GPU node that takes four minutes to load weights means a four-minute capacity hole after every eviction, and a cluster sized with no headroom for that hole will shed load every time it patches a node — a self-inflicted outage during routine maintenance.
Audit the dependencies nobody drew on the diagram
Architecture diagrams show the request path. Outages frequently come from services that are not on it, because every tier in that path has dependencies of its own that were never given a redundancy requirement.
The recurring offenders, each of which has taken down an otherwise well-designed cluster:
- Internal DNS. Every service discovery lookup depends on it, and a DNS outage presents as every component failing simultaneously — which sends responders looking for a shared cause that does not exist.
- The secrets manager. Workers that fetch credentials at start-up cannot start during its outage. The running system looks fine until something restarts, so the failure surfaces during the recovery from an unrelated incident, at the worst possible moment.
- The container registry. A node that loses its image cache cannot pull a replacement pod. Mirror internally, and pin digests rather than mutable tags.
- Certificate renewal. An expired internal TLS certificate takes out mutual TLS between tiers on a schedule set months earlier, and the alert usually arrives after the expiry rather than before.
- License and entitlement servers. Some inference runtimes phone home. In an air-gapped or sovereign deployment this is worth confirming explicitly rather than assuming, because it converts an external dependency into a hard availability ceiling.
Run a controlled chaos engineering drill
Prior to certifying an on-premises AI deployment for production, execute a controlled chaos engineering test:
- Establish Baseline Telemetry: Generate steady synthetic traffic and record baseline Time to First Token (TTFT) and throughput.
- Sever a Primary GPU Worker: Terminate a primary GPU inference node abruptly (
kill -9or physical power cord pull). - Monitor Ingress & Failover: Verify that the load balancer removes the unhealthy worker within 2 seconds and routes subsequent queries to healthy replicas.
- Verify Client Experience: Inspect whether client applications display graceful retry prompts rather than fatal error screens.
- Re-attach the Node: Bring the server back online and verify that the platform re-integrates the node cleanly once model weights warm up.
Remember that high availability and disaster recovery solve distinct problems. HA keeps the system online during component failures; disaster recovery restores state after catastrophic data loss. Review our companion guide on private AI backup and recovery to ensure both disciplines are aligned.
To evaluate high-availability topologies for your enterprise, discover ExemplaryAI’s sovereign deployment options and schedule an enterprise architecture demo to review custom clustering, failover, and operational resilience frameworks.