Private AI costs: building a total-cost-of-ownership model
Build a private AI cost model that separates infrastructure, staffing, support, utilization, and successful workload completion using explicit assumptions.

Sarath Chandran
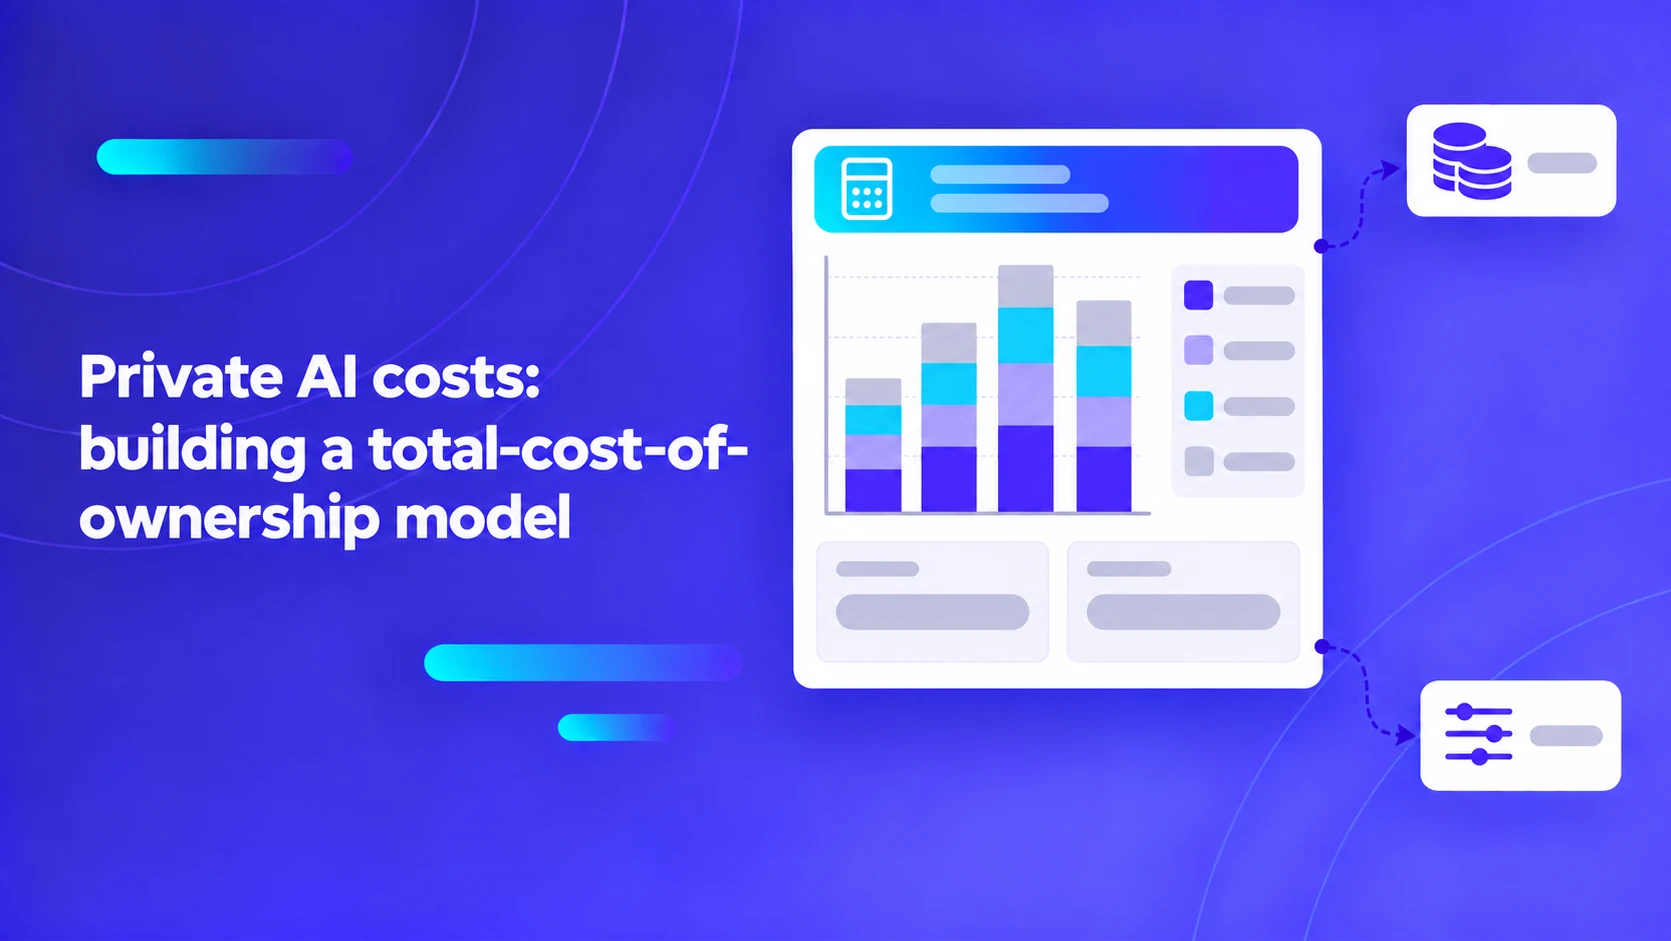
Private AI cost is the cost of operating a usable service over time. Hardware is one input. Staffing, storage, support, unused capacity, maintenance, and the work required to keep the service dependable can change the result substantially.
In enterprise IT procurement, executive leadership often evaluates on-premises generative AI deployments through an overly simplistic financial lens: comparing the capital expenditure (CapEx) of purchasing an 8-GPU server rack against the monthly per-token API invoices of commercial cloud models. This naive comparison inevitably produces financial surprises. Hardware acquisition typically represents less than 35% of the true Total Cost of Ownership (TCO) of private AI. The remaining 65% comprises power, cooling, datacenter rack allocation, specialized MLOps engineering salaries, high-availability reserve capacity, disaster recovery replication, continuous model evaluation, and software enterprise support contracts.
Key Architecture Rule: Total Cost of Ownership must be evaluated on an amortized, fully loaded unit-cost basis over a multi-year horizon. Measure the fully burdened cost per completed business transaction (e.g., cost per verified document or cost per resolved customer inquiry), not isolated token costs or raw server purchase receipts.
Choose the exact business workflow before building financial models
A frequent mistake in enterprise budgeting is attempting to cost "an AI platform for the whole company." Generalizing across an entire enterprise obscures the vastly different computational and human costs associated with distinct operational use cases:
- Casual Knowledge Retrieval: 500 corporate employees submitting occasional 200-word conversational queries requires minimal GPU capacity, with high idle periods overnight and on weekends.
- Continuous Back-Office Extraction: A dedicated pipeline processing 50,000 multi-page vendor invoices weekly requires sustained, high-throughput GPU memory bandwidth, dedicated OCR preprocessing workers, and human-in-the-loop review queues.
To build an accurate financial model, specify:
- Workload Ingestion Volume: Average and peak daily transactions, document page counts, and audio hours.
- Context Token Footprint: Input context window size (e.g., 2,000 tokens vs. 32,000 tokens) and generated completion lengths.
- Availability & Redundancy Requirements: Single-node non-critical versus
N+1multi-node high availability with sub-second failover. - Maintenance & Update Cadence: Monthly model fine-tuning, security patching, and evaluation benchmarking.
Our companion guide on on-premises AI workload sizing explains how to translate business task descriptions into concrete GPU VRAM and compute capacity allocations.
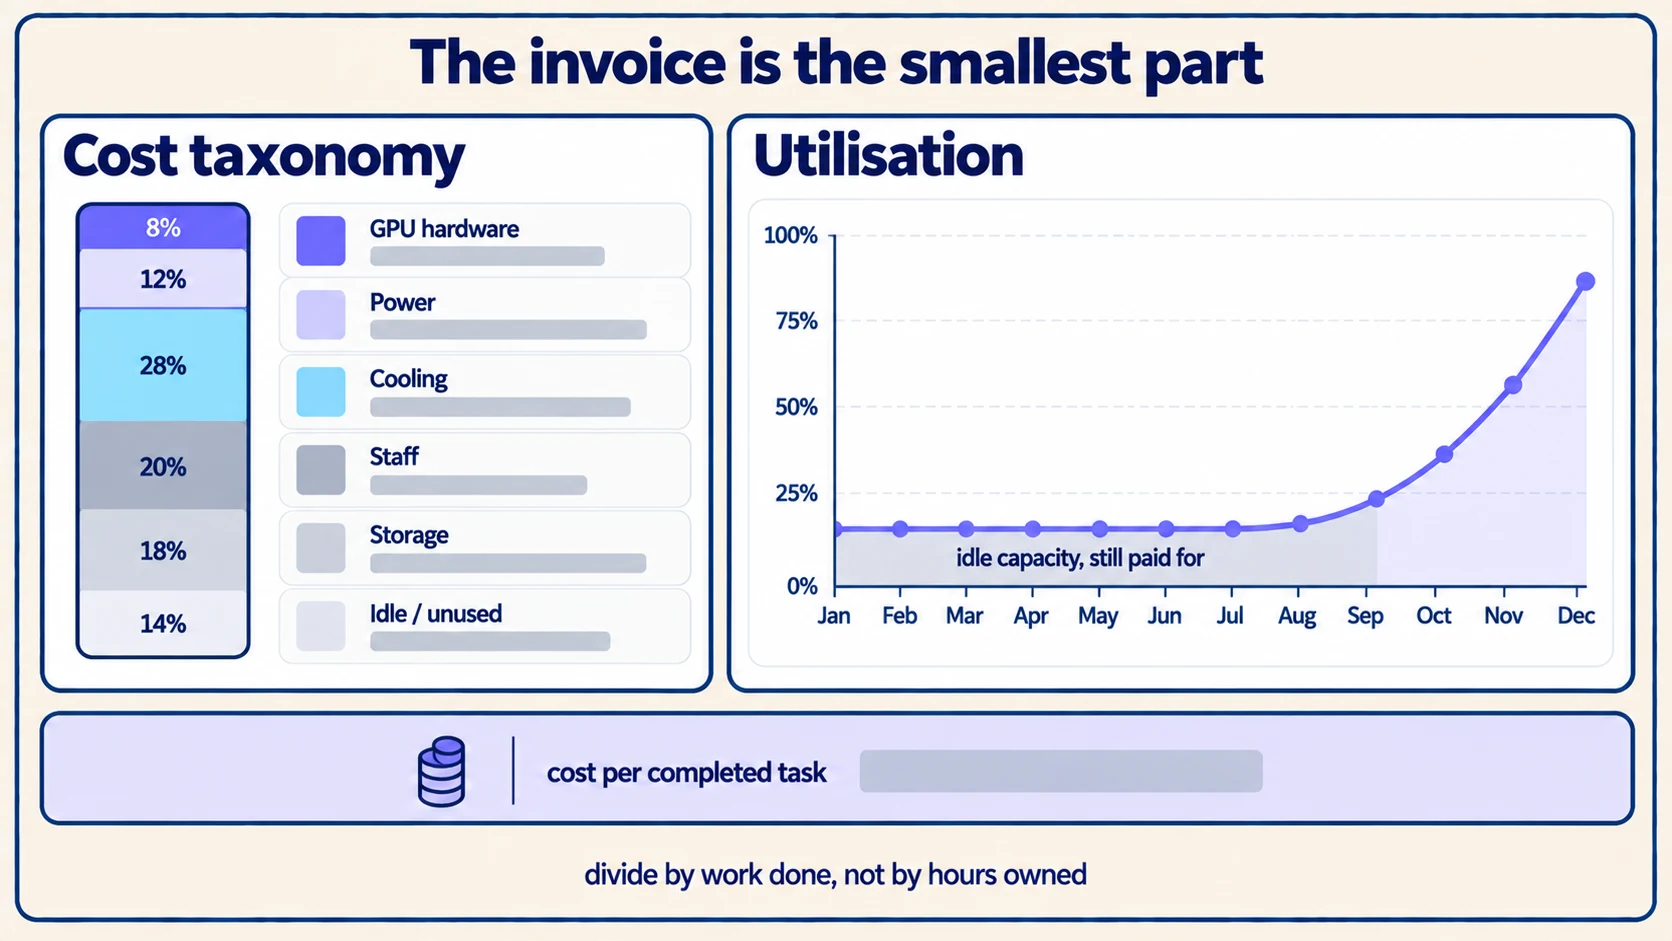
Deconstruct the comprehensive private AI cost taxonomy
To prevent unbudgeted operational expenses, finance and platform engineering teams must track costs across six discrete tiers. The table below details these categories, their operational drivers, and the common omissions that distort financial modeling. The figures below are deliberately synthetic and illustrative; they do not represent vendor quotations or proprietary product claims.
| Cost category | Primary operational drivers | Critical financial questions | Common budgeting omissions |
|---|---|---|---|
| 1. Compute & Hardware CapEx | GPU servers (e.g., H100/A100/L40S), high-speed InfiniBand/NVLink, NVMe storage. | Purchase outright vs. lease? 3-year vs. 5-year straight-line depreciation? | Reserve capacity held idle purely for high-availability failover. |
| 2. Datacenter & Power OpEx | Electricity consumption (kW), Power Usage Effectiveness (PUE) multipliers, liquid cooling. | What is the cost per kWh? Does rack power density exceed 15kW/rack limits? | Facility upgrades required to cool high-density 8-GPU servers. |
| 3. Storage & Network Fabric | Multi-tier storage: fast NVMe for weights, object storage for raw files, vector stores. | What is annual document growth? What is cross-zone backup egress cost? | Maintaining duplicate staging and disaster recovery environments. |
| 4. Enterprise Software & Support | Operating systems, Kubernetes enterprise distributions, model serving support, vector DB licenses. | Are licenses priced per socket, per core, or per GPU node? | Separate infrastructure support vs. application software support tiers. |
| 5. Specialized Engineering Labor | MLOps engineers, platform reliability engineers (SRE), security auditors. | What percentage of FTE time is consumed by maintenance, patching, and tuning? | Time required for manual prompt engineering and regression testing. |
| 6. Continuous Evaluation & Quality | Domain benchmark curation, annotation software, human-in-the-loop exception review. | How much does human review cost per document when confidence thresholds fail? | Retesting and auditing model accuracy following upstream updates. |
Avoid double counting. If a managed private cloud infrastructure provider includes 24/7 hardware replacement and datacenter cooling in an all-inclusive annual lease, do not add separate facility line items. Conversely, purchasing bare-metal hardware does not magically provide the engineers required to configure CUDA drivers and manage Kubernetes GPU operators.
The GPU utilization paradox: On-premises vs. public cloud APIs
The financial viability of self-hosting AI hinges on the GPU Utilization Paradox:
- If an enterprise purchases an on-premises GPU server that sits idle 85% of the time (running only during sporadic business hours), the fully loaded amortized cost per generated token can be significantly higher than paying a public cloud provider per million tokens.
- Conversely, when an organization achieves steady, high-volume GPU utilization (> 60% sustained capacity across 24/7 batch processing and daytime interactive queries), the amortized cost per token plummets to a fraction of commercial API fees.
The table below illustrates a representative annual cost model for an enterprise running an on-premises 8-GPU cluster serving an intelligent document and assistant workflow. The values below are deliberately synthetic and illustrative; they do not represent market quotes or proprietary ExemplaryAI pricing.
| Annualized budget component | Illustrative annual allocation | Percentage of TCO |
|---|---|---|
| Compute Hardware Amortization (3-year lifecycle) | $42,000 | 32.8% |
| Datacenter Facilities, Power & Cooling (PUE 1.35 @ $0.12/kWh) | $14,400 | 11.3% |
| Storage, Backup & Disaster Recovery Replication | $9,600 | 7.5% |
| Enterprise Software Licenses & Support Contracts | $18,000 | 14.1% |
| Dedicated Platform Engineering / MLOps Labor (0.25 FTE) | $35,000 | 27.3% |
| Continuous Quality Auditing & Model Evaluation | $9,000 | 7.0% |
| Total Annualized Cost of Ownership | $128,000 | 100.0% |
Now examine the resulting unit economics across three distinct operational utilization scenarios:
- Low Utilization (Under-Adopted Pilot): The platform processes 100,000 completed tasks per year. Fully loaded unit cost: $1.28 per completed task.
- Moderate Utilization (Baseline Production): The platform processes 500,000 completed tasks per year. Fully loaded unit cost: $0.26 per completed task.
- High Utilization (Optimized Enterprise Scale): The platform processes 2,000,000 completed tasks per year. Fully loaded unit cost: $0.064 per completed task.
This mathematical reality highlights why infrastructure planning cannot be decoupled from user adoption and workflow automation. If your business volume cannot sustain moderate GPU utilization, a private on-premises deployment must be justified by sovereign security, air-gapped compliance, or intellectual property mandates rather than purely financial ROI.
Pro Tip: When evaluating vendor hardware quotes, always incorporate a 1.3x to 1.5x Power Usage Effectiveness (PUE) multiplier on electricity costs. Modern 8-GPU servers can draw up to 10.2 kW under full tensor compute load; powering and cooling that single chassis in a commercial colocation facility can exceed $1,200 per month in electricity alone!
Define the operational unit economic denominator
In technical benchmarks, engineering teams frequently report costs in "dollars per million tokens." While useful for comparing raw inference engines, this metric is fundamentally incomplete for enterprise business cases.
In an end-to-end enterprise workflow, token inference is merely one component of a larger transaction. Consider an accounts payable invoice extraction pipeline:
- The transaction begins with multi-page PDF ingestion, optical deskewing, and OCR tokenization.
- The system executes RAG retrieval, vector search, and LLM entity extraction.
- An automated business rule validator verifies arithmetic totals.
- If confidence falls below 0.85, the invoice routes to a human accounts payable clerk, incurring 3 minutes of manual labor ($2.50 in human operator cost).
If an engineering team cuts GPU token costs by 20% by deploying an aggressive, low-precision 4-bit quantized model, but that model's lower accuracy increases the human exception review rate from 5% to 15%, the overall process cost escalates dramatically! Saving $0.002 in GPU inference compute while adding $2.50 in manual human exception handling represents a catastrophic net financial loss.
NVIDIA’s inference cost benchmarking analysis demonstrates why cost comparisons must account for latency constraints and batching efficiencies, and NVIDIA’s benchmarking metrics reference formalizes the relationship between throughput, concurrency, and hardware utilization.
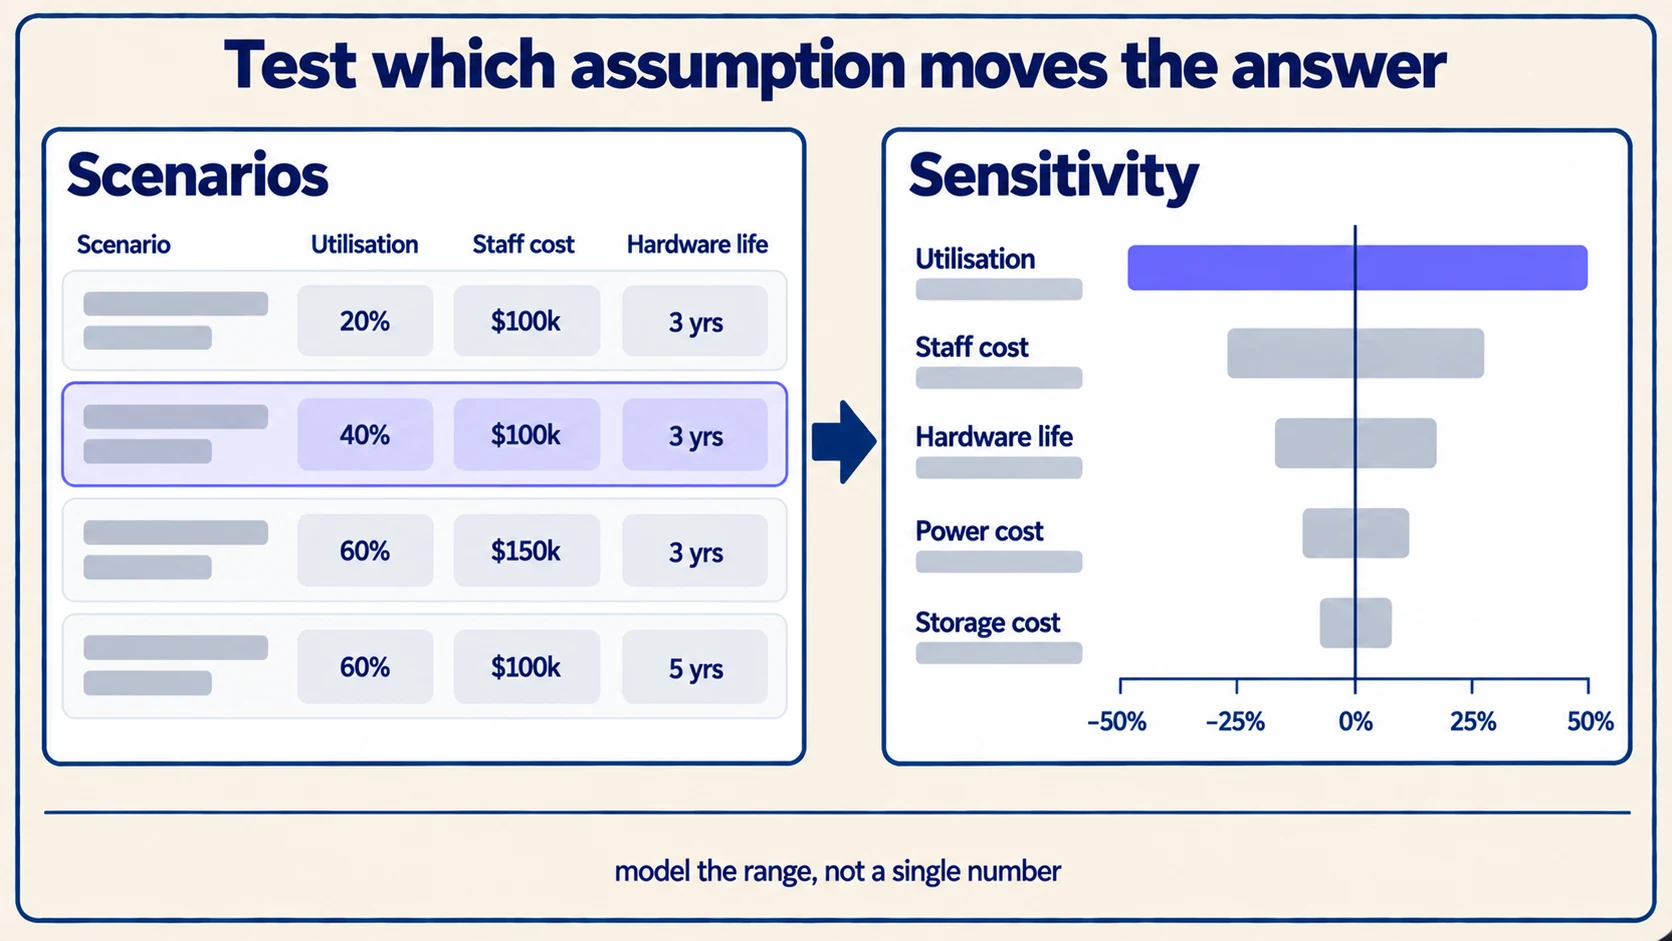
Conduct multi-scenario sensitivity modeling before capital allocation
Before committing to massive multi-year capital hardware purchases, platform teams must subject their financial models to multi-variable sensitivity analysis:
- Workload Volatility: What happens to unit economics if adoption grows 300% faster than anticipated? When will the cluster hit the capacity ceiling, forcing a second multi-server hardware purchase?
- Model Architecture Shifts: If the business requires transitioning from an 8B parameter model to a 70B parameter model within 18 months, does the existing GPU topology have the memory capacity to support it, or will hardware need premature replacement?
- Hardware Lifecycles & Depreciation: If the enterprise standardizes on a 3-year straight-line depreciation schedule, how does that impact the annual operating expense versus a 5-year schedule?
For comprehensive architectural guidance on balancing private hosting against hybrid and sovereign models, consult our foundational private AI deployment planning guide.
To explore how our platform optimizes private AI economics, review ExemplaryAI’s sovereign deployment options. When you are ready to construct a customized, defensible financial model for your organization's document and AI workloads, schedule an enterprise architecture briefing to review detailed TCO templates and hardware sizing calculators.